Author:
Kai Knudsen
Updated:
10 October, 2025
This chapter describes depth of anesthesia monitoring, with a review of BIS and Entropy, which are standardized methods to determine and monitor anesthesia depth during general anesthesia.
- Depth of Anesthesia Monitoring Using EEG
- Consciousness and General Anesthesia
- Clinical and Pharmacological Indicators
- EEG and Depth of Anesthesia
- Processed EEG and Monitoring Systems
- Awareness Under Anesthesia
- Postoperative Cognitive Disorders
- Clinical Applications
- Limitations
- Conclusions
- Summary
- Summary of EEG Changes
- Spectral Edge Frequency (SEF)
- References
- Anesthesia Depth Monitoring
Depth of Anesthesia Monitoring Using EEG
Introduction
Safe anesthesia requires a careful balance between adequate unconsciousness, amnesia, analgesia, muscle atonia, and preserved physiological stability. Traditionally, anesthetic depth has been assessed indirectly through clinical signs and drug concentrations. Over the past decades, however, electroencephalography (EEG) and processed EEG indices have been developed as tools for objective monitoring. These methods have attracted considerable attention, not least because of the risk of intraoperative awareness and postoperative neurocognitive disorders.
Consciousness and General Anesthesia
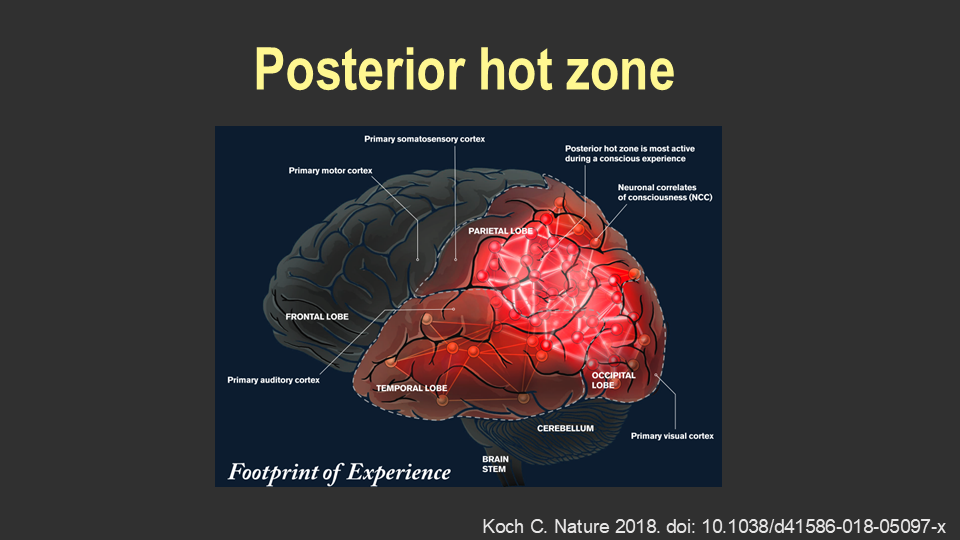
Consciousness can be defined as the capacity to perceive and experience stimuli. This presupposes wakefulness, which in turn depends on the functional integrity of the brainstem (Brown et al., 2010). Neuroscientific research has demonstrated that posterior cortical regions—the so-called “posterior hot zone”—are central to conscious experience (Koch, 2018). General anesthesia can be described as a pharmacologically induced state in which consciousness, memory, nociception, and motor function are temporarily suspended.
Clinical and Pharmacological Indicators
In routine practice, anesthetic depth has often been judged by autonomic and somatic signs such as blood pressure, heart rate, sweating, pupillary reactions, body movements, and respiratory patterns. Measurements of drug concentrations, for example by end-tidal gas analysis or target-controlled infusion (TCI), have also been used. However, these parameters do not directly reflect the patient’s state of consciousness (Brown et al., 2010).
EEG and Depth of Anesthesia
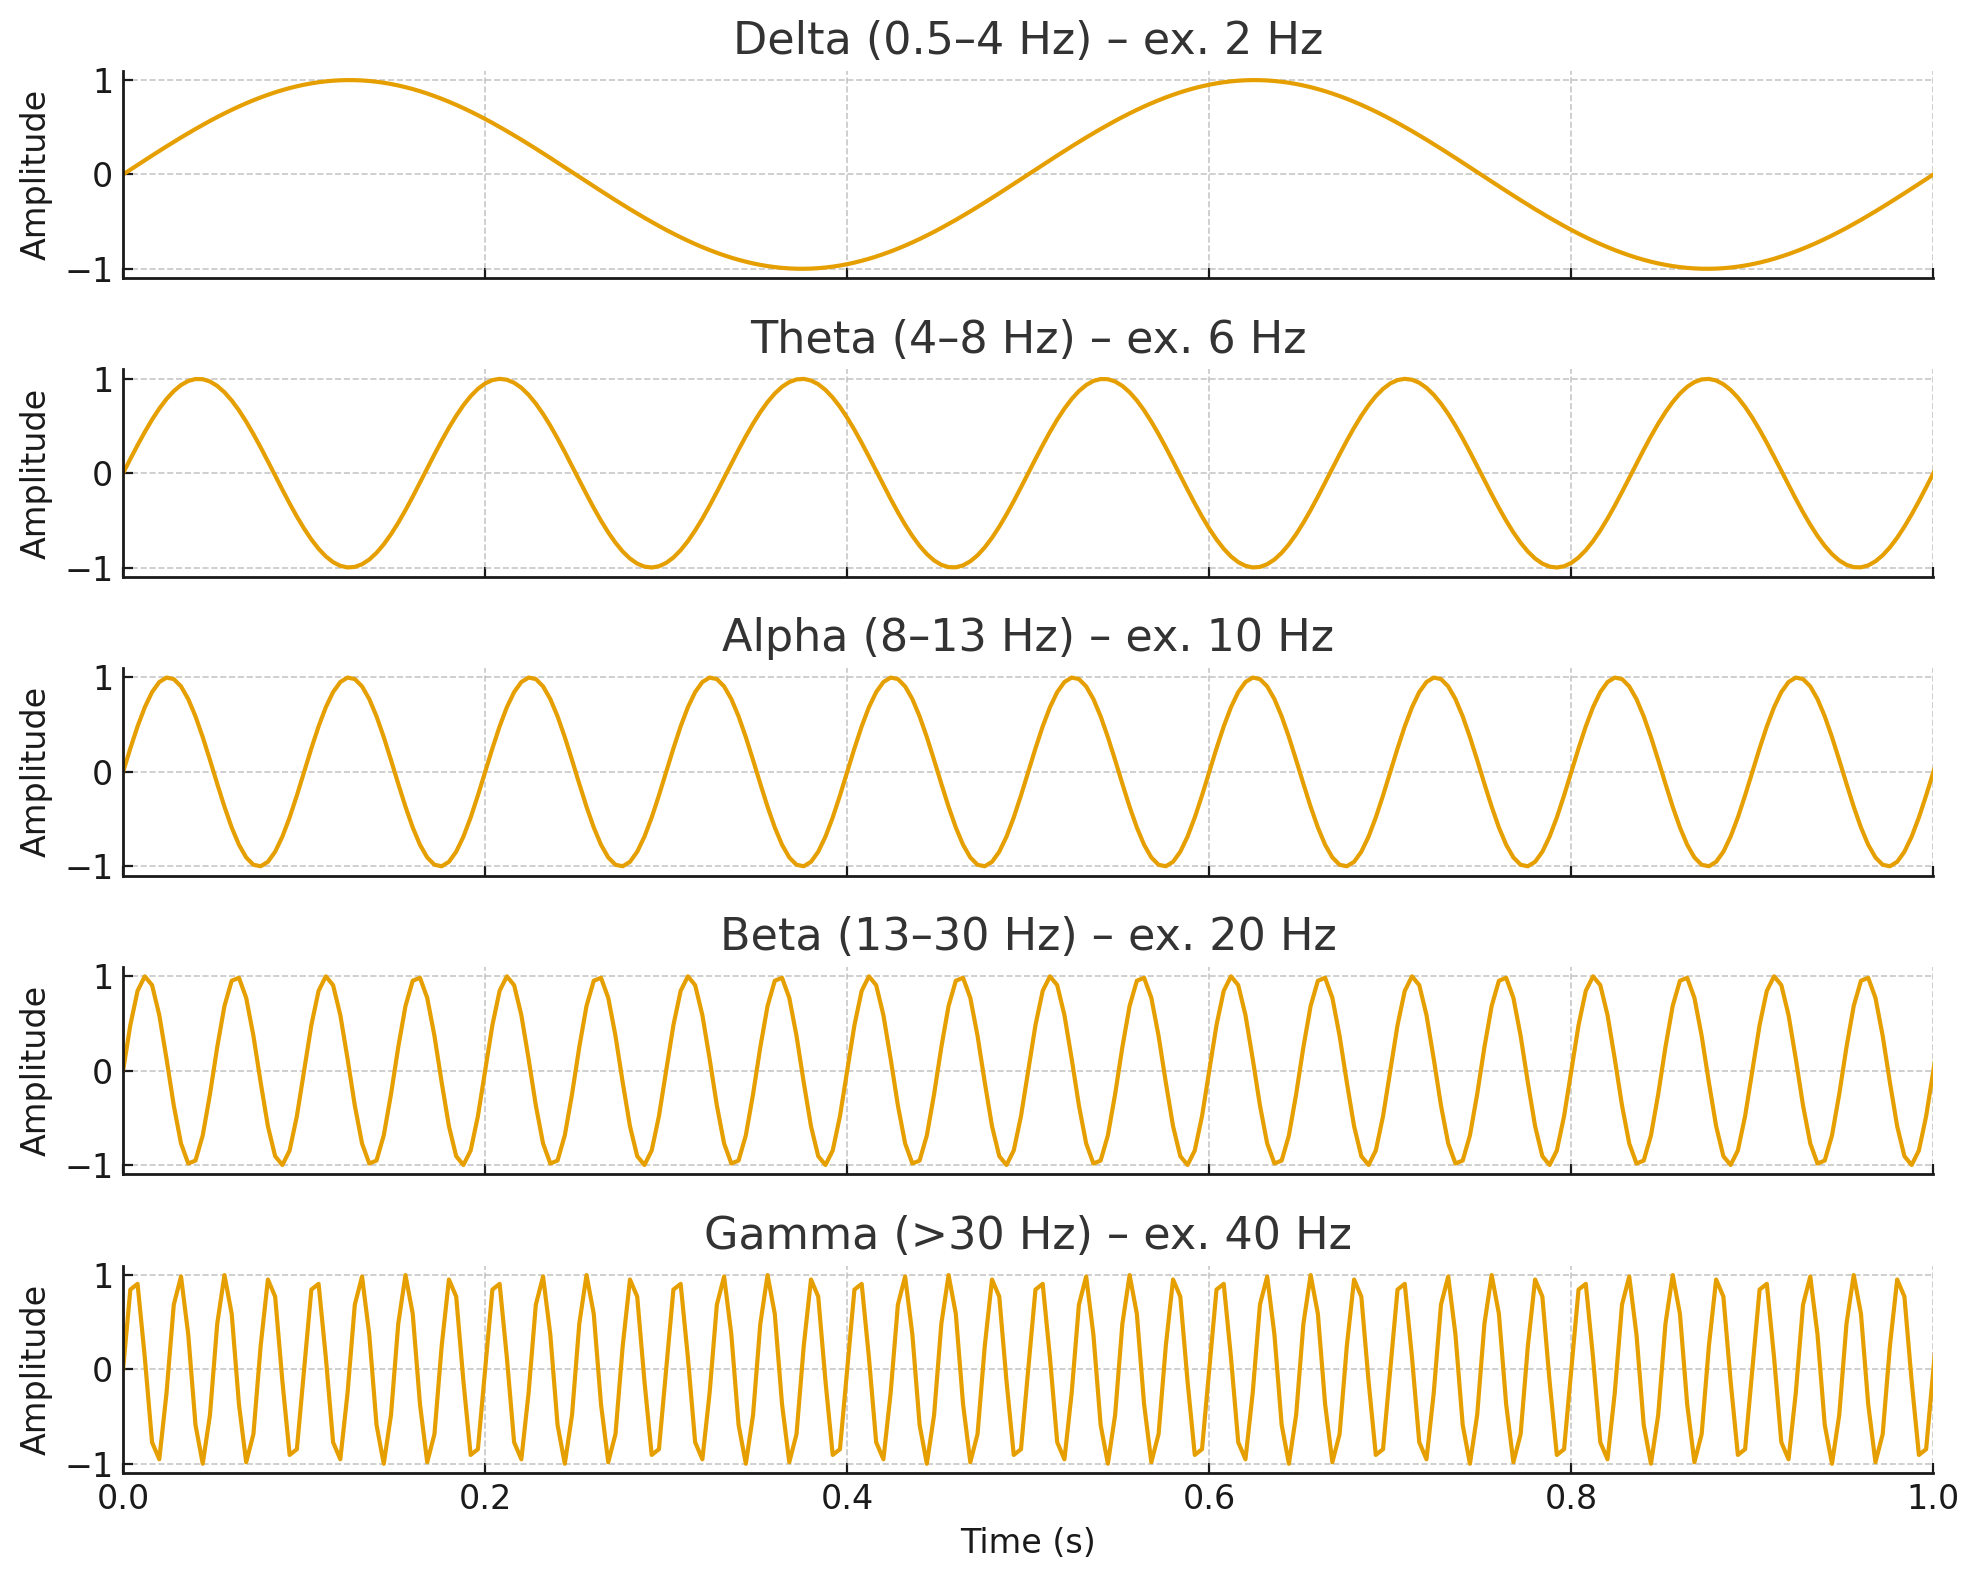
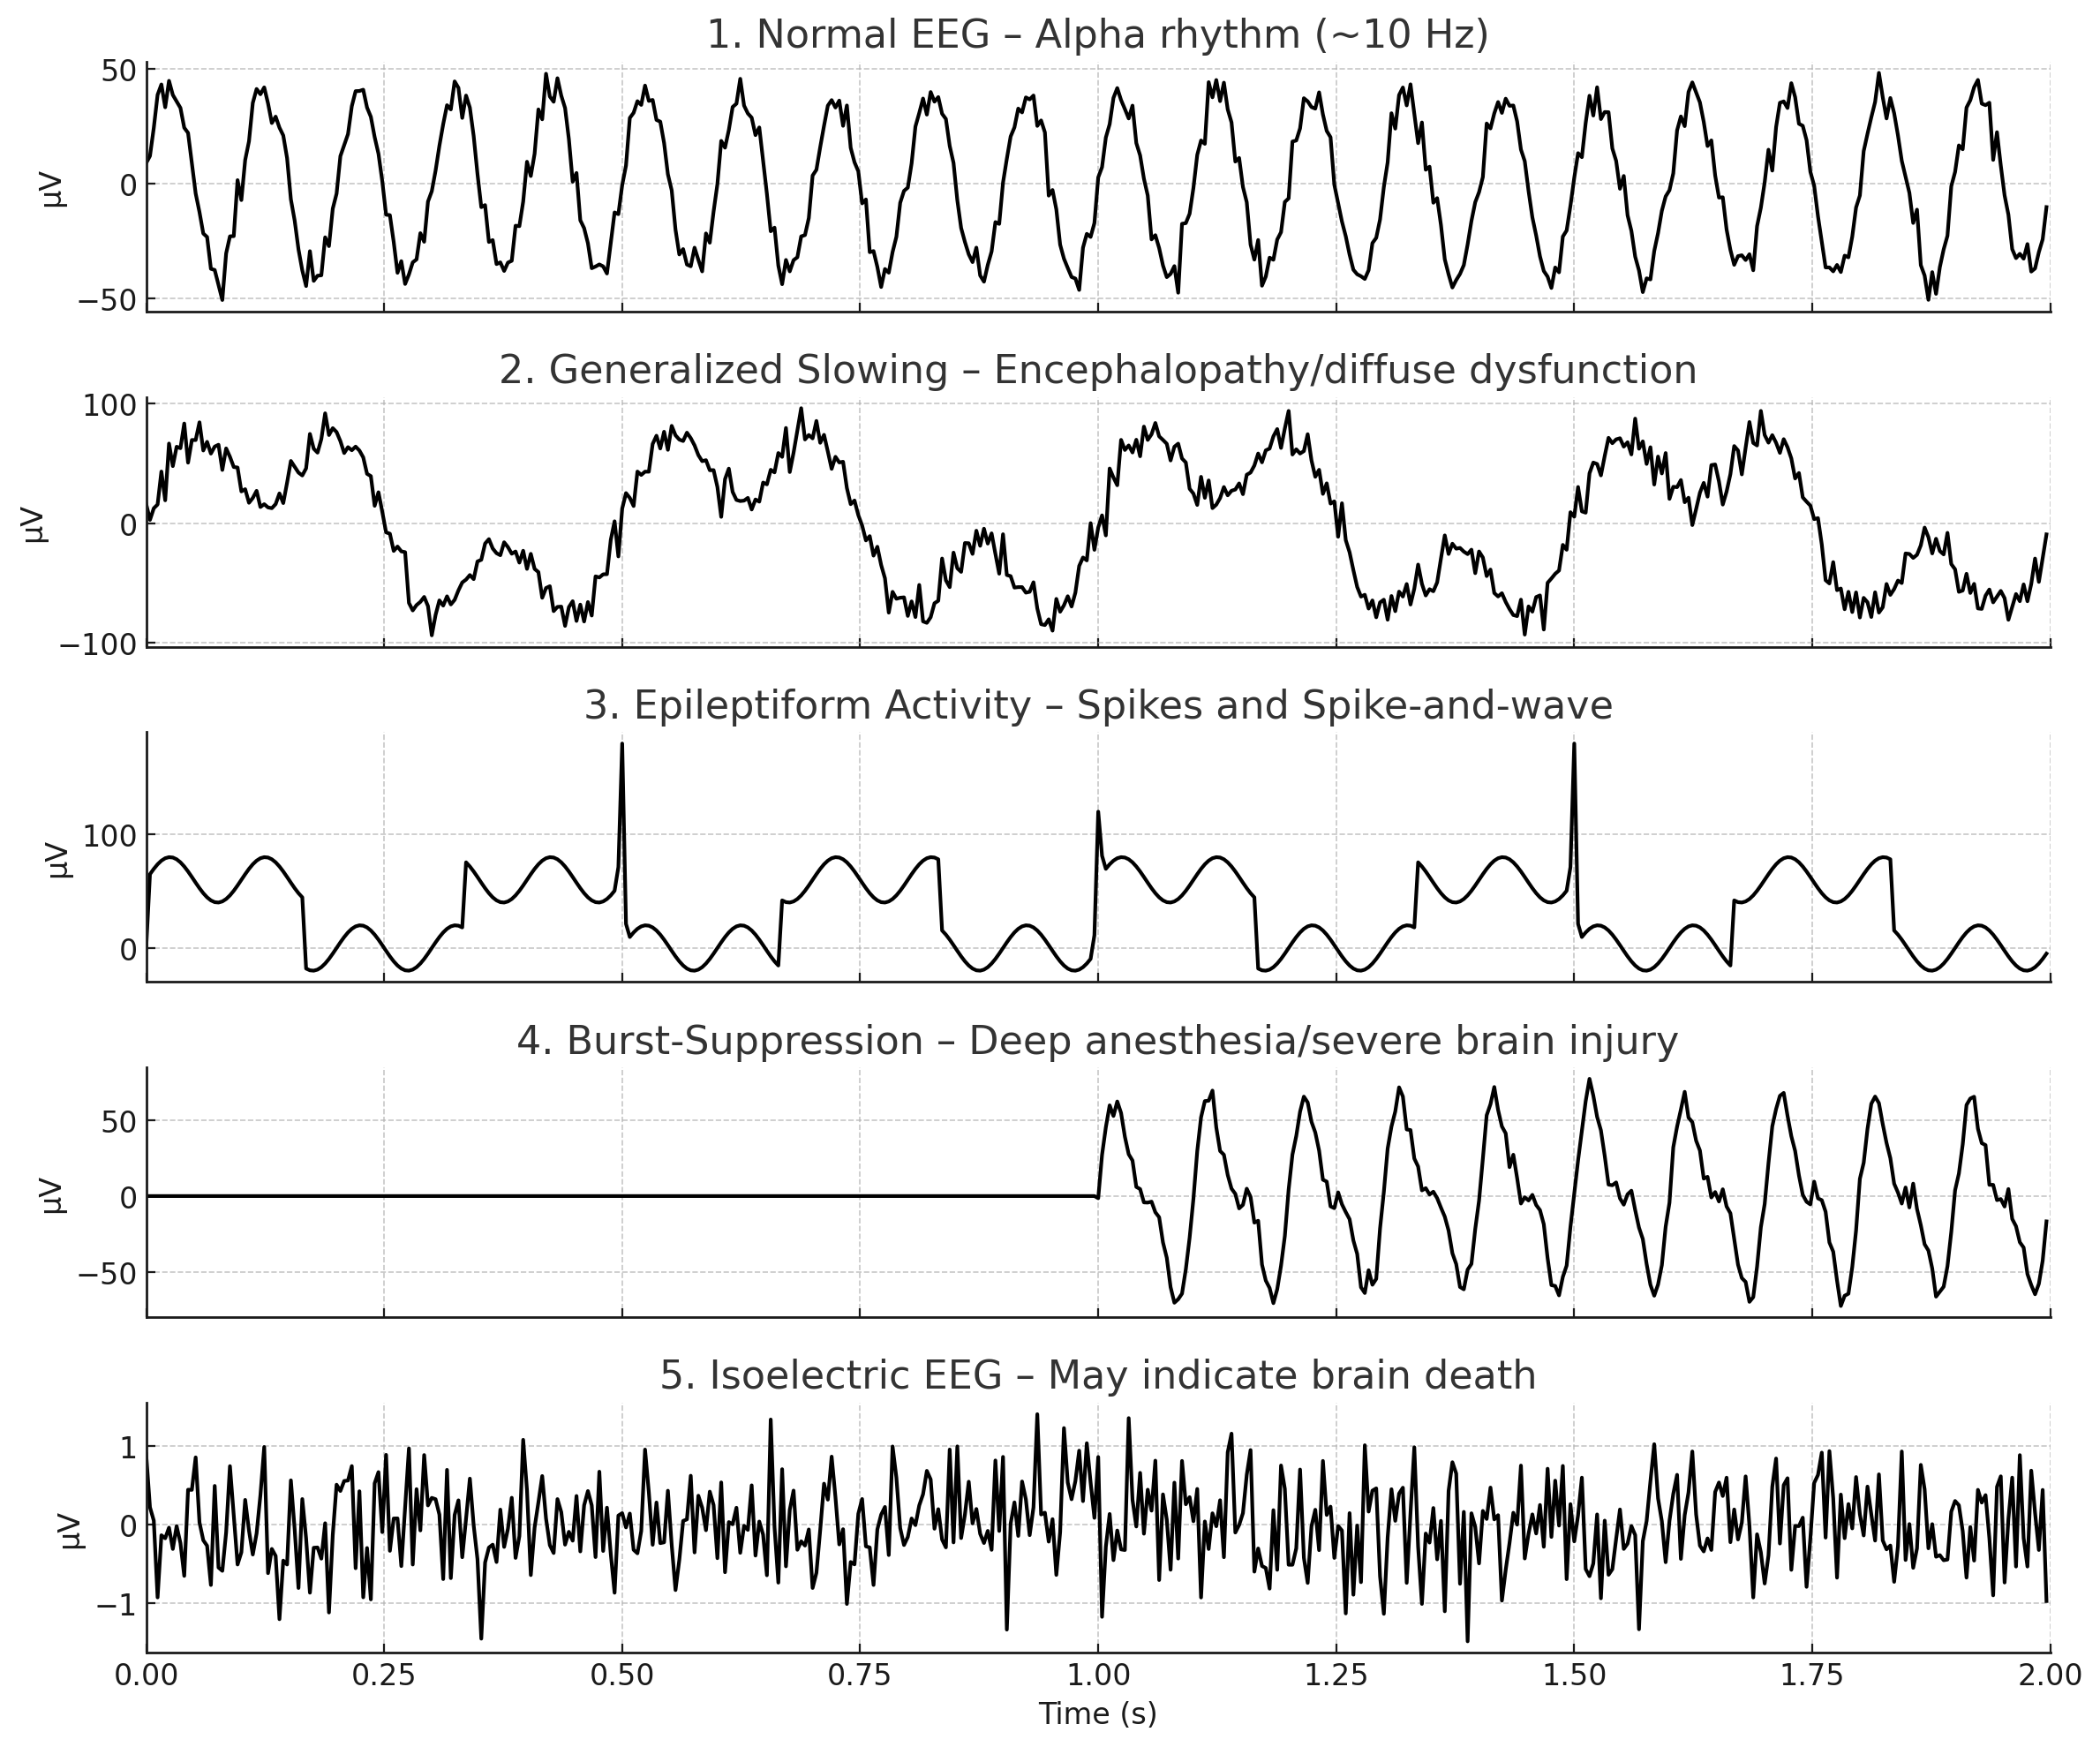
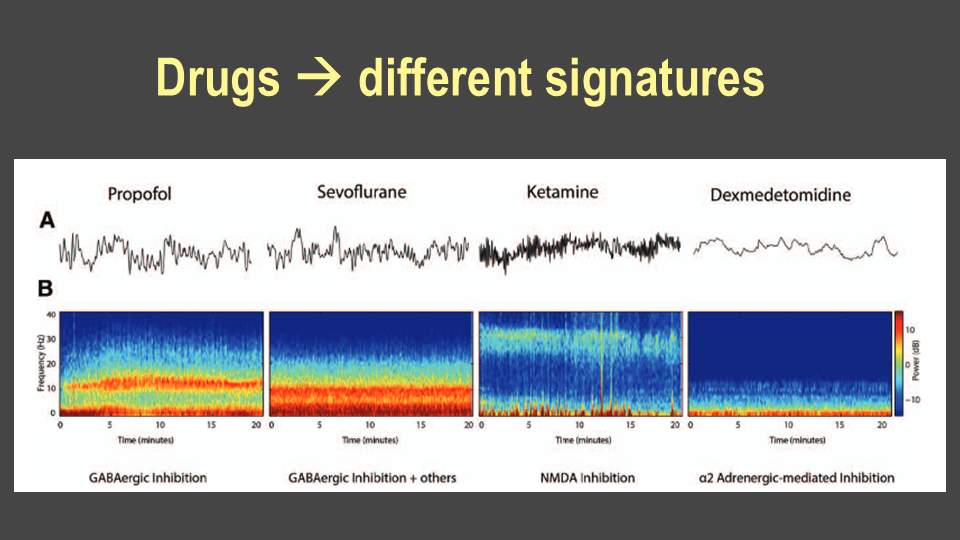
EEG was first recorded in anesthetized patients as early as the 1930s (Gibbs, 1937). Since then, it has become clear that anesthetic drugs produce dose-dependent changes in brain electrical activity (Brown et al., 2010). Fourier analysis allows decomposition of the signal into frequency bands, with alterations in alpha, theta, and delta activity being particularly relevant. As anesthetic depth increases, one typically observes enhanced delta power, slow-wave activity, and, in deep states, burst-suppression patterns.
Processed EEG and Monitoring Systems
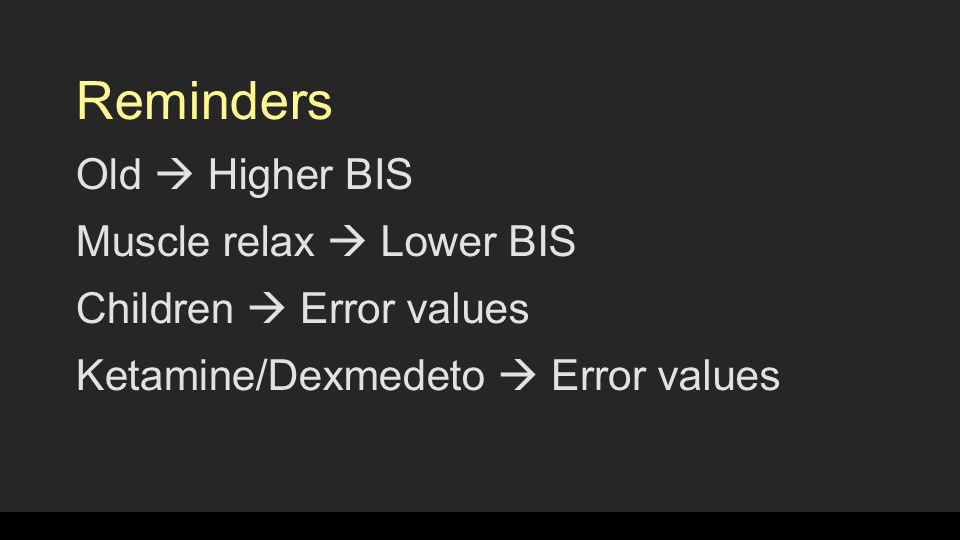
To facilitate clinical use, processed EEG indices have been developed. The most established is the Bispectral Index (BIS), introduced in 1996. BIS is based on spectral analysis and bispectral parameters and provides a numerical value between 0 and 100. During surgical anesthesia, a target range of 40–60 is generally sought (Purdon et al., 2015). However, BIS is influenced by patient factors (age, pediatric patients, neurological disease) as well as the choice of anesthetic drugs. Ketamine and dexmedetomidine may produce misleading values, and neuromuscular blocking agents can lower BIS despite preserved consciousness (Connor et al., 2022).
Awareness Under Anesthesia
Intraoperative awareness is a serious phenomenon, although the incidence is low. A Swedish prospective study of approximately 12,000 patients found an incidence of 0.15%, half of whom developed post-traumatic symptoms (Sandin et al., 2000; Lennmarken et al., 2002).
Several randomized trials have investigated whether BIS monitoring can reduce this risk. The B-Aware trial demonstrated a lower incidence of awareness with BIS compared to routine monitoring (Myles et al., 2004), while other studies did not find a difference compared with end-tidal anesthetic concentration monitoring (Avidan et al., 2008; Avidan et al., 2011).
A Cochrane review including more than 40,000 patients concluded that BIS reduces awareness compared to clinical signs, but not compared to end-tidal concentration monitoring (Lewis et al., 2019).
Postoperative Cognitive Disorders
Postoperative delirium (POD) and postoperative cognitive dysfunction (POCD) are particularly common in elderly patients. In the ISPOCD study (Moller et al., 1998), cognitive decline was observed in 26% of patients after one week and in 10% after three months. Long-term follow-up has shown associations with increased mortality, early retirement, and reduced quality of life (Steinmetz et al., 2009).
Studies examining BIS and cognitive outcomes have yielded mixed results. Some randomized controlled trials have shown reduced POD with BIS-guided anesthesia (Radtke et al., 2013; Chan et al., 2013), whereas others, such as the ENGAGES (Wildes et al., 2019) and ENGAGES-Canada trials (Deschamps et al., 2024), did not demonstrate a difference. The BALANCED trial reported no difference in mortality, although a substudy suggested improved cognitive function (Short et al., 2019; Evered et al., 2021).
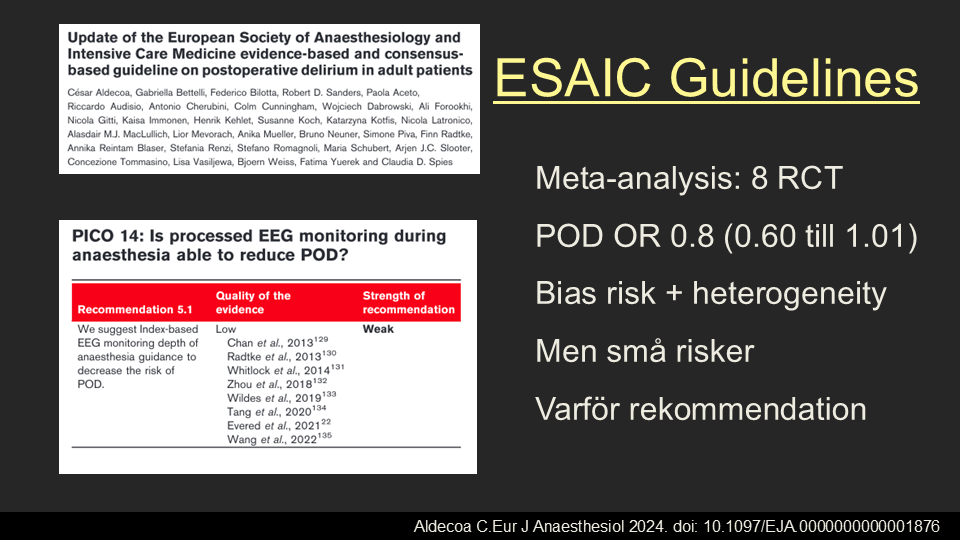
In summary, the benefit of processed depth-of-anesthesia monitoring for cognitive outcomes remains uncertain, although meta-analyses suggest small risk reductions (Aldecoa et al., 2024).
Clinical Applications
- Prevention of awareness: Processed EEG can reduce the incidence of intraoperative awareness, especially in high-risk patients.
- Anesthetic titration: Monitoring facilitates individualized drug dosing, preventing both under- and overdosage.
- ICU sedation: Continuous EEG or processed indices help tailor sedation in critically ill patients, balancing adequate unconsciousness with timely awakening.
- Research and neuroscience: EEG has become an important tool for investigating mechanisms of anesthesia and consciousness.
Limitations
Despite their clinical value, EEG-based methods have limitations.
- Artifacts from electromyographic activity, electrocautery, or poor electrode contact can distort readings.
- Inter-individual variability means that identical index values may correspond to different levels of anesthesia in different patients.
- Drug-specific effects: Certain agents (e.g., ketamine, nitrous oxide) may produce EEG patterns that complicate index interpretation.
- Not a direct measure of consciousness: EEG reflects cortical activity but cannot guarantee complete absence of awareness.
Conclusions
- EEG is a robust physiological marker of the effects of anesthesia.
- BIS can reduce the risk of awareness compared to clinical signs, but not compared to end-tidal gas analysis.
- The evidence for improved postoperative cognitive outcomes is conflicting.
- Recommendations emphasize caution with high anesthetic doses and avoidance of burst-suppression, particularly in elderly patients and risk groups such as those undergoing cardiac surgery.
Summary
EEG and processed EEG indices represent valuable tools for monitoring depth of anesthesia. They provide objective information about cortical activity and drug effects, complementing traditional clinical and pharmacological indicators. Used appropriately, they can enhance patient safety, optimize anesthetic dosing, and reduce the risk of both intraoperative awareness and postoperative neurocognitive complications. However, their interpretation requires an understanding of the underlying physiology, technical limitations, and pharmacological interactions.
Summary of EEG Changes
Alpha – dominant rhythm in relaxed wakefulness, often attenuates under anesthesia.
Delta and slow waves – increased with deeper anesthesia or encephalopathy.
Anteriorization – alpha and slow activity shift from posterior to frontal regions during anesthesia.
Burst-suppression – alternating high-amplitude bursts and flat suppression, seen in deep anesthesia or severe brain injury.
Spectral Edge Frequency (SEF)
| State | Typical SEF (Hz) | Comment |
|---|
| Awake | 20–30 Hz | High activity, predominantly beta |
| Lightly sedated | 15–20 Hz | Alpha and beta dominant |
| Surgical anesthesia | 8–14 Hz | Delta and alpha dominant |
| Very deep anesthesia | <8 Hz | Mainly delta, possible burst suppression |
References
- Aldecoa C. et al. Eur J Anaesthesiol. 2024; doi:10.1097/EJA.0000000000001876
- Avidan MS. et al. N Engl J Med. 2008;358:1097–1108. doi:10.1056/NEJMoa0707361
- Avidan MS. et al. N Engl J Med. 2011;365:591–600. doi:10.1056/NEJMoa1100403
- Brown EN. et al. N Engl J Med. 2010;363:2638–2650. doi:10.1056/NEJMra0808281
- Chan MT. et al. J Neurosurg Anesthesiol. 2013;25:33–42. doi:10.1097/ANA.0b013e3182712fba
- Connor W. et al. Anesth Analg. 2022;134:1012–1022. doi:10.1213/ANE.0000000000006119
- Deschamps A. et al. JAMA. 2024;331:814–825. doi:10.1001/jama.2024.8144
- Evered L. et al. Br J Anaesth. 2021;127:65–74. doi:10.1016/j.bja.2021.08.003
- Gibbs FA. Arch Intern Med. 1937;60:154–166. doi:10.1001/archinte.1937.00180010159012
- Koch C. Nature. 2018;557:S8–S12. doi:10.1038/d41586-018-05097-x
- Lennmarken C. et al. Acta Anaesthesiol Scand. 2002;46:302–307. doi:10.1034/j.1399-6576.2002.t01-1-460301.x
- Lewis SR. et al. Cochrane Database Syst Rev. 2019;CD003843. doi:10.1002/14651858.CD003843.pub4
- Moller JT. et al. Lancet. 1998;351:857–861. doi:10.1016/s0140-6736(97)07382-0
- Myles PS. et al. Lancet. 2004;363:1757–1763. doi:10.1016/S0140-6736(04)16300-9
- Purdon PL. et al. Anesthesiology. 2013;118:1431–1447. doi:10.1073/pnas.1221180110
- Purdon PL. et al. Anesthesiology. 2015;123:937–960. doi:10.1097/ALN.0000000000000841
- Radtke FM. et al. Br J Anaesth. 2013;110:17–25. doi:10.1093/bja/aet055
- Sandin RH. et al. Lancet. 2000;355:707–711. doi:10.1016/S0140-6736(99)11010-9
- Short TG. et al. Lancet. 2019;394:1907–1917. doi:10.1016/S0140-6736(19)32315-3
- Steinmetz J. et al. Anesthesiology. 2009;110:548–555. doi:10.1097/ALN.0b013e318195b569
- Wildes TS. et al. JAMA. 2019;321:473–483. doi:10.1001/jama.2018.22005
Anesthesia Depth Monitoring
Monitoring of awareness or anesthesia depth has become an integral part of modern anesthesia. Traditionally, and still to a large extent, clinical assessment alone is used to gauge the depth of anesthesia during surgery. Clinicians assess the patient’s pulse, blood pressure, movements, eye movements, pupils, tears, response to surgical stimuli, etc., but overall, this assessment can be challenging, often uncertain, and subject to limitations. There are often significant differences in assessments of anesthesia depth between different individuals. Experienced anesthesia personnel can usually assess anesthesia depth well, but it can still be difficult, especially with complicating factors such as the use of muscle relaxants and various reactions to physiological parameters like pulse and blood pressure. The patient’s reactions to surgical stimuli can vary depending on age, resting pulse, physical condition, presence of heart arrhythmias, beta-blocker medication, bleeding, etc.

BIS Monitor in the Operating Room
The use of available anesthesia depth monitors now allows for better control of anesthesia and helps avoid both over- and under-dosing of anesthetic agents. However, it has not been proven that the use of anesthesia depth monitoring reduces the incidence of awareness during anesthesia.
Anesthesia depth monitoring allows for controlled induction, steerable general anesthesia, more controlled awakening, and often a faster recovery. It becomes easier to manage the awakening process in relation to the surgery, which is useful both with inhalation anesthetics and with intravenous anesthesia or a combination of both. Several scientific studies have shown that overdosing of anesthetics with EEG suppression in the form of “Burst Suppressions” increases the risk of postoperative memory loss (POCD – Post Operative Cognitive Dysfunction), which can be reduced with anesthesia depth monitoring.

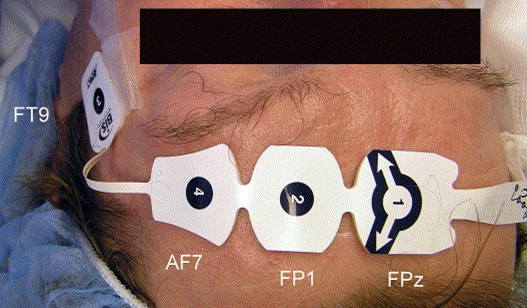
Measuring Anesthesia Depth with Simple Skin Electrodes
The methods used clinically include a simplified form of EEG recording via 3-4 flat skin electrodes attached to the patient’s forehead. EEG measures weak electrical activities in the cerebral cortex, about 100 times weaker than the ECG signal. The most commonly available clinical systems are Entropy and BIS (Bispectral Index). There are also other systems for monitoring awareness, such as brainstem audiometry, Auditory Evoked Potentials (AEP), which involves measuring electrical activity from the auditory centers with sound stimulation, and Sensory Evoked Potentials (SEP), used to map the function of nerve pathways that transmit sensory input. SEP involves stimulating a sensory nerve in an arm or leg while monitoring signals from sensory centers in the brain.
The most common methods for measuring anesthesia depth in clinical practice are the EEG-based methods BIS and Entropy. In EEG-based anesthesia depth monitoring, four parameters are analyzed in the EEG measured online. These parameters include activation of high-frequency waves (14-30 Hz), the level of synchronized low-frequency waves, the occurrence of burst suppressions, and the presence of isoelectric EEG.
The EEG output is displayed in standard anesthesia monitoring as an index from 0 to 100, along with a continuous EEG curve. Entropy shows two values in parallel, while BIS shows an indexed value. In BIS, a numerical value is displayed based on the EEG signal over the last 15 seconds. A fully awake patient normally has a BIS value of 90-100, corresponding to a fast, frequent EEG wave with low amplitude. Between 80-90, the patient is usually asleep but can be awakened. Between 60-80, the amplitude is higher, and the patient is somnolent and may react to pain stimuli but responds sluggishly or not at all to verbal cues. Between 40 and 60, the patient is under general anesthesia, with high amplitudes and low-frequency fluctuations in the EEG. Deep anesthesia is indicated by BIS values around 20, which again show low amplitude with some fluctuations. In very deep anesthesia, burst suppressions increase in number, eventually leading to isoelectric EEG. Burst suppressions are displayed in BIS as an SR value, indicating the percentage of the EEG signal that was completely suppressed during the last minute. Burst suppression shows peaks in EEG activity alternating with isoelectric EEG. BIS is less effective with anesthesia induced by ketamine, nitrous oxide, or dexmedetomidine. Patients with dementia may have a lower baseline BIS value.
- 90-100: Fully awake. The patient is fully conscious, with a fast, frequent EEG wave and low amplitude.
- 80-90: Light sedation. The patient is asleep but easily arousable, often used for procedural sedation where the patient may need to respond to commands.
- 60-80: Moderate sedation. The patient is somnolent (drowsy) and may react to painful stimuli but may not respond to verbal commands. The EEG shows higher amplitude and lower frequency waves.
- 40-60: General anesthesia. This range is typically the target during surgery. The patient is unresponsive to verbal commands and has low-frequency, high-amplitude EEG waves. This is considered a safe range for general anesthesia.
- 20-40: Deep anesthesia. The patient is deeply anesthetized, with further reduction in BIS value indicating deeper levels of unconsciousness.
- 0-20: Burst suppression and isoelectric EEG. This range indicates very deep anesthesia, where burst suppression occurs (brief periods of electrical silence in the brain), or the EEG may become isoelectric (flat), indicating little to no brain activity.
Anesthesia depth monitors provide a good opportunity to awaken the patient quickly and in a controlled manner. At values between 80-90, the patient is responsive to verbal cues, and at lower values, it is usually not meaningful to interact with the patient verbally, as you can calmly wait for the patient to become more awake before active awakening. When attaching the flat skin electrodes to the patient’s forehead, the skin should first be wiped with alcohol. The skin can also be cleaned with a little sandpaper. The electrodes can be applied after anesthesia induction but are usually attached beforehand. Anesthesia depth monitors should be standard practice in modern anesthesia. These also seem to work on small children but have not been evaluated as extensively as in adults.
BIS – bispectral index
BIS (Covidien) is an anesthesia depth monitor that uses a simplified form of EEG recording via four flat skin electrodes attached to the patient’s forehead during anesthesia. EEG measures weak electrical activities in the cerebral cortex, about 100 times weaker than the ECG signal. In BIS, a numerical value between 0 and 100 is displayed based on the EEG signal. BIS also provides an EMG signal reading. BIS allows for the measurement of anesthesia depth during general anesthesia. The term BIS stands for bispectral index, which decreases during anesthesia, allowing for continuous scale registration. BIS primarily shows a numerical value (BIS value) in parallel with a continuous EEG curve.
BIS Interval and Anesthesia Depth
| BIS-value | Anesthesia Depth |
|---|---|
| 100 | Fully awake. The patient is fully conscious, with a fast, frequent EEG wave and low amplitude. |
| 80 | Light medium sedation. May respond to commands spoken in a loud voice or slight tremors |
| 60 | General anesthesia. Low probability of explicit memory experience. Do not respond to verbal stimuli. |
| 40 | Deep hypnotic state |
| 20 | Burst suppression |
| 0 | Isoelectric EEG |
Alongside the BIS value, three numerical values are presented on the anesthesia monitor in the form of EMG, SQI, and SR. EMG is the electromyographic signal (0-100). Ideally, the EMG value should be below 5. At values above 50 in EMG, the patient is likely too awake and needs to be more deeply anesthetized, or there are too many artifacts. At high EMG values, the BIS value should be interpreted with caution. SQI (Signal Quality Index) provides a value of the EEG signal quality (0-100) measured over the last minute. SQI should be as close to 100 as possible; over 90% indicates good quality (it can also be displayed as a bar graph). At values below 80%, the signal may be insufficient to present a reliable value. SR (Suppression Rate) measures the percentage of burst suppressions recorded in the last minute as a percentage of the EEG curve (%). These usually occur during deep anesthesia, often at BIS values below 20. Above 20, burst suppressions are much less common.
The BIS value is presented as continuous values between 0 and 100, calculated from the EEG curve over the last 15 seconds. BIS trends can show BIS values over time. The measurement of the BIS value is based on the principle that the EEG signal is progressively reduced during anesthesia, eventually leading to isoelectric EEG. At a value of 100, the patient is fully awake, and a value of 0 corresponds to isoelectric EEG. Burst suppression shows peaks in EEG activity alternating with isoelectric EEG.
Using BIS allows for the control of anesthesia and avoids over- and under-dosing of anesthetic agents. Anesthesia depth monitoring permits controlled induction, steerable general anesthesia, more controlled awakening, and often a faster recovery. Anesthesia depth monitors should always be used in conjunction with clinical assessment of anesthesia depth. BIS can present 5-minute and 30-minute trends.
The goal is usually to achieve BIS values between 40 and 50 during surgical anesthesia. A fully awake patient normally has a value of 90-100, corresponding to a fast, frequent EEG wave with low amplitude. Between 80-90, the patient is usually asleep but can be awakened. Between 60-80, the amplitude is higher, and the patient is somnolent and may react to pain stimuli but responds sluggishly or not at all to verbal cues. Between 40 and 60, the patient is under general anesthesia, with high amplitudes and low-frequency fluctuations in the EEG. Deep anesthesia is indicated by values around 20, which again show low amplitude with some fluctuations. In very deep anesthesia, burst suppressions increase in number, eventually leading to isoelectric EEG.
Bolus administration of anesthetic agents can cause sudden drops in BIS values, as can the administration of inhalation anesthetics, beta-blockers, clonidine, or other drugs that reduce alertness. The decrease may also be due to the administration of muscle relaxants, severe blood pressure drops, hypothermia, increased intracranial pressure, hypoglycemia, or anoxia. A paradoxical brief decrease in BIS values may occur just before awakening during excitation, but this change is usually short-lived. A sudden increase in BIS values may indicate that the patient has become more awake but may also be due to high-frequency artifacts, such as from diathermy or NMT; check the EMG value. The increase may also naturally be due to too shallow anesthesia or a sudden increase in stimuli from the surgeon.
Anesthesia depth monitors provide a good opportunity to awaken the patient quickly and in a controlled manner. At values between 80-90, the patient is responsive to verbal cues, and at lower values, it is usually not meaningful to interact with the patient verbally, as you can calmly wait for the patient to become more awake before active awakening. When attaching the flat skin electrodes to the patient’s forehead, the skin should first be wiped with alcohol. The skin can also be cleaned with a little sandpaper. The electrodes can be applied after anesthesia induction but are usually attached beforehand. Anesthesia depth monitors should be standard practice in modern anesthesia. However, BIS is less effective with anesthesia induced by ketamine, nitrous oxide, or dexmedetomidine. Patients with dementia may have a lower baseline BIS value.
BIS (Bispectral Index) monitoring is a method used to measure the depth of anesthesia by analyzing EEG (electroencephalogram) signals. The BIS monitor provides a numerical value between 0 and 100 that helps anesthesiologists assess the level of consciousness and anesthesia in a patient. The BIS value corresponds to the following intervals and levels of anesthesia depth:


Sedline
SEDLine® (Masimo)

Brain Cells with Electrical Activity
SEDLine – Principles and Function
SEDLine® brain function monitoring is an EEG-based method for assessing depth of anesthesia. The system uses a frontal four-channel EEG recording via forehead electrodes (placed according to a modified 10–20 system). Unlike BIS, which is based on a single channel, SEDLine analyzes multiple channels simultaneously, allowing both lateralization and more detailed analysis of signal patterns.
Processed Parameter: Patient State Index (PSI)
The PSI is a numerical index (0–100) that, like BIS, reflects the degree of wakefulness or anesthetic depth.
- The value is derived from spectral analysis, bispectral measures, interhemispheric coherence, and pattern recognition.
- The target value for surgical anesthesia is typically 25–50.
- PSI is considered less sensitive to artifacts than BIS and more robust across different anesthetic agents, but it is still affected by drugs such as ketamine and dexmedetomidine.
Additional Parameters
In addition to PSI, SEDLine provides several other variables and visual tools:
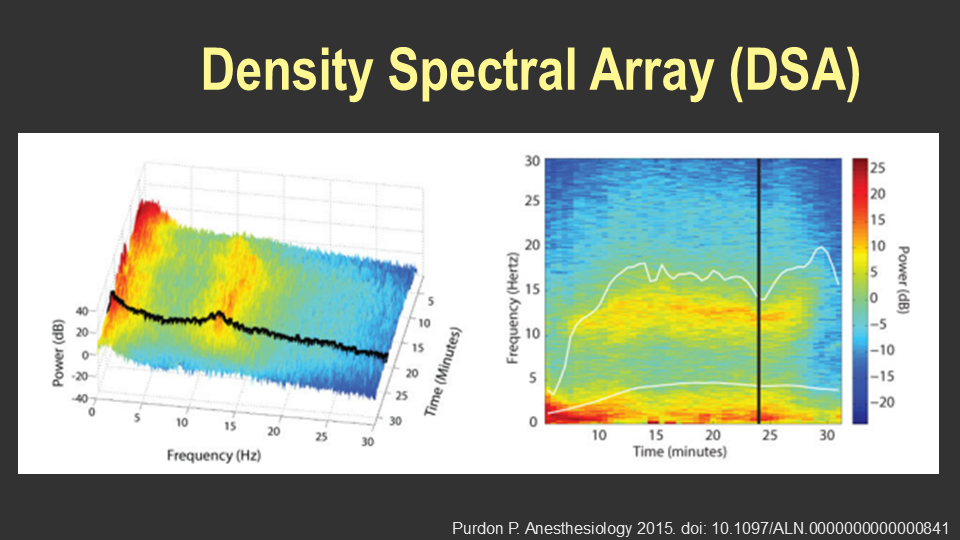
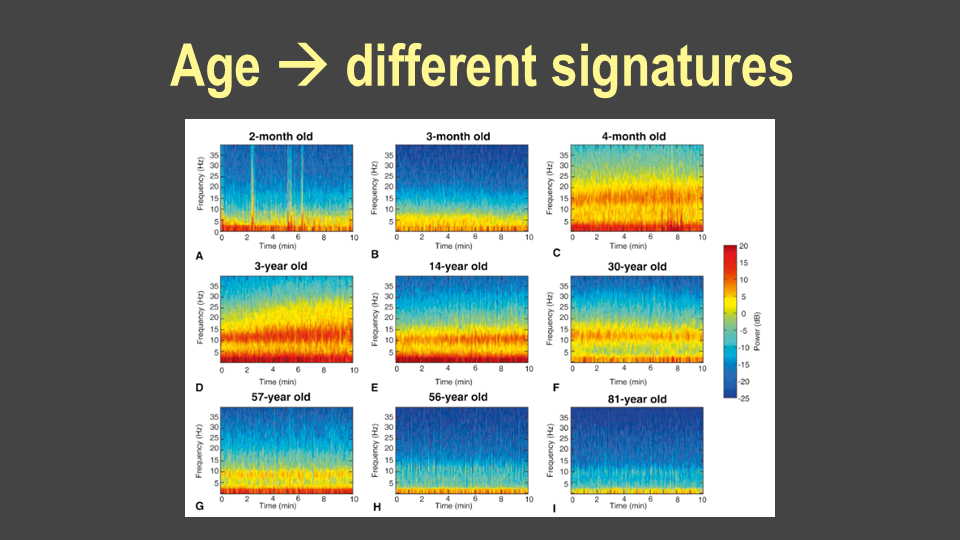
- Density Spectral Array (DSA): A color-coded spectrogram display showing amplitude/frequency over time for both left and right hemispheres. This enables real-time tracking of changes and comparison of hemispheric patterns.
- Burst Suppression Ratio (BSR): The proportion of time the EEG is in burst-suppression. High BSR levels are associated with deep anesthesia and an increased risk of postoperative neurocognitive disorders.
- Spectral Edge Frequency (SEF): The frequency below which a defined proportion (usually 95%) of the signal’s power is contained. A low SEF indicates deep anesthesia.
- Asymmetry Index: Based on differences between right and left hemispheres, relevant in conditions such as stroke or focal pathology.
Clinical Use
SEDLine is used in a manner similar to BIS but with the advantage of multichannel analysis. Studies have shown that DSA and PSI can be particularly valuable for avoiding excessively deep anesthesia (and consequently high burst-suppression) in elderly and frail patients (Xu et al., 2021).
Limitations
- Values may be affected by electrode placement, artifacts (EMG, movement, electrocautery).
- Interpretation difficulties may occur with atypical EEG signatures (e.g., ketamine anesthesia, pediatric anesthesia, neurological disease).
- Evidence regarding reduced risk of awareness or improved cognitive outcomes remains limited compared to BIS.
Comparison of SEDLine® vs BIS
| Feature | SEDLine® (Masimo) | BIS (Medtronic/Covidien) |
|---|---|---|
| EEG channels | 4 frontal channels (modified 10–20) | 1 frontal channel |
| Processed index | PSI (0–100) | BIS (0–100) |
| Target range for surgery | 25–50 | 40–60 |
| Signal analysis | Spectral + bispectral + interhemispheric coherence + pattern recognition | Spectral + bispectral + time-domain features |
| Additional parameters | DSA (spectrogram), BSR, SEF, Asymmetry Index | BSR, SEF (in some versions) |
| Artifact sensitivity | Less sensitive to artifacts than BIS, but still affected (e.g., EMG, movement) | Sensitive to EMG and electrocautery artifacts |
| Drug sensitivity | Affected by ketamine, dexmedetomidine; considered more robust across anesthetics | Affected by ketamine, dexmedetomidine, muscle relaxants |
| Unique advantage | Multichannel analysis enables lateralization and richer signal interpretation | Widely validated, simple single-channel system, strong evidence base |
| Limitations | Evidence still limited compared to BIS regarding awareness and cognitive outcomes | Cannot assess hemispheric asymmetry; may misinterpret certain drug effects |
Narcotrend for Monitoring Depth of Anesthesia
The Narcotrend monitor is an EEG-based device designed to assess depth of anesthesia through automatic pattern recognition. It categorizes EEG signals into stages ranging from A (awake) to F (burst suppression/electrical silence) (PubMed).
Key Features
- Stage Classification: EEG is classified into stages A–F, some of which are subdivided (e.g., D0–D2 for normal anesthesia, E0–E2 for deep anesthesia, and F0–F2 for burst suppression) (atm.amegroups.org).
- Numeric Index: Provides a dimensionless index from 100 (awake) to 0 (electrical silence) (PubMed).
- Multi-Modal Output: Offers raw EEG waveform display, trend graph (“cerebrogram”), power spectrum, and derived parameters (PubMed).
- Decision Support: Enables real-time monitoring, potentially reducing risks of over- or under-anesthesia (distraumamedical.com).
Clinical Evidence & Benefits
- Recovery Time: In a large multicenter study with over 4,600 patients undergoing propofol-based anesthesia, those using Narcotrend monitoring showed significantly faster emergence compared to standard practice (PubMed).
- Detection Capabilities: The Narcotrend system reliably identifies burst suppression and aligns well with conventional staging; its classification performance compares favorably to the BIS monitor (PubMed).
- Enhancing Safety: It aids in titrating anesthesia precisely, enhancing patient safety and reducing anesthetic consumption (distraumamedical.com, atm.amegroups.org).
Limitations & Considerations
- Single-Channel EEG: Although useful, it may not capture all regional brain activity and can occasionally misclassify due to limited electrode placement (bjanaesthesia.org).
- Drug & Artifact Sensitivity: As with other EEG monitors, the readings can be affected by specific drugs and artefacts, requiring cautious interpretation by clinicians (journals.lww.com, PubMed).
- Evidence for Outcomes: While beneficial in anesthesia management, more research is needed to confirm effects on long-term outcomes like awareness and postoperative cognitive dysfunction (atm.amegroups.org).
Quick Comparison: Narcotrend vs Other Indexes
| Monitor | Index Range | Key Feature |
|---|---|---|
| Narcotrend | 100 → 0 | Multi-modal staging, clear trends |
| BIS | 100 → ~0 | Single-channel index |
| NARCOguide | Similar to NTrend | Emerging, good correlation |
In short, Narcotrend is a robust tool for real-time EEG-based anesthesia depth monitoring. Its strengths lie in comprehensive output, fast recovery support, and precise titration capabilities. While established in clinical settings, always use alongside other clinical parameters and remain mindful of its limitations.
Entropy
Entropy (Datex-Ohmeda) is an anesthesia depth monitor that uses a simplified form of EEG recording via three flat skin electrodes attached to the patient’s forehead. EEG measures and reads weak electrical activities in the cerebral cortex, about 100 times weaker than the ECG signal. In Entropy, two numerical values are displayed based on the EEG signal reading over the last 15 seconds, plus the reading of the EMG signal in the forehead. Entropy allows for the measurement of anesthesia depth during general anesthesia. The word entropy means noise or irregularity, which decreases during anesthesia, allowing entropy values to be continuously recorded during anesthesia. Entropy displays three numerical values in parallel with a continuous EEG curve. These are presented as varying values between 0 and 100, similar to monitoring with BIS. The monitoring is based on the principle that the EEG signal progressively reduces during anesthesia, eventually leading to isoelectric EEG. At a value of 100, the patient is fully awake, and a value of 0 corresponds to isoelectric EEG.
Entropy presents RE (Response Entropy), SE (State Entropy), and BSR (Burst Suppression Rate). RE bases its value on high frequencies in the EEG, including signals from the facial muscles (EMG signals in the forehead), and provides a value between 0 and 100. RE signals more easily capture rapid changes in alertness, including signals from the facial muscles (Forehead EMG). SE bases its value on stable lower frequencies corresponding to the anesthesia depth, which reacts slightly slower than RE. SE provides a value between 0-91 and primarily follows the RE value. BSR (Burst Suppression Rate) shows the number of Burst Suppressions recorded within a minute (0-100%). Burst suppression shows peaks in EEG activity alternating with isoelectric EEG.
Using Entropy allows for better control of anesthesia and avoids over- and under-dosing of anesthetic agents. Anesthesia depth monitoring permits controlled induction, steerable general anesthesia, more controlled awakening, and often a faster recovery. Anesthesia depth monitors should always be used in conjunction with clinical assessment of anesthesia depth. It is not uncommon for anesthesia personnel to detect changes in alertness with clinical signs before observing changes in Entropy. Entropy can present 5-minute and 30-minute trends.
The goal is usually to achieve values between 40 and 50 in SE and RE during surgical anesthesia. A fully awake patient normally has a value of 90-100, corresponding to a fast, frequent EEG wave with low amplitude. Between 80-90, the patient is usually asleep but can be awakened. Between 60-80, the amplitude is higher, and the patient is somnolent and may react to pain stimuli but responds sluggishly or not at all to verbal cues. Between 40 and 60, the patient is under general anesthesia, with high amplitudes and low-frequency fluctuations in the EEG. Deep anesthesia is indicated by values around 20, which again show low amplitude with some fluctuations. In very deep anesthesia, burst suppressions increase in number, eventually leading to isoelectric EEG. During surgical stimulation, it is more likely that the RE and SE values will differ.
Anesthesia depth monitors provide a good opportunity to awaken the patient quickly and in a controlled manner. At values between 80-90, the patient is responsive to verbal cues, and at lower values, it is usually not meaningful to interact with the patient verbally, as you can calmly wait for the patient to become more awake before active awakening.
References
- Purdon PL, Sampson A, Pavone KJ, Brown EN.
Clinical electroencephalography for anesthesiologists: Part I: Background and basic signatures.
Anesthesiology. 2015;123(4):937–960.
https://doi.org/10.1097/ALN.0000000000000841 - Xu N, et al.
Patient state index and density spectral array-guided anesthesia reduces postoperative delirium in elderly patients undergoing carotid endarterectomy.
Front Neurol. 2021;12:666814.
https://doi.org/10.3389/fneur.2021.666814 - Drover DR, Lemmens HJ, Pierce ET, Plourde G, Loyd G, Ornstein E.
Patient state index: Titration of delivery and recovery from propofol, alfentanil, and nitrous oxide anesthesia.
Anesthesiology. 2002;97(1):82–89.
https://doi.org/10.1097/00000542-200207000-00014
Disclaimer:
The content on AnesthGuide.com is intended for use by medical professionals and is based on practices and guidelines within the Swedish healthcare context.
While all articles are reviewed by experienced professionals, the information provided may not be error-free or universally applicable.
Users are advised to always apply their professional judgment and consult relevant local guidelines.
By using this site, you agree to our Terms of Use.
