
Author:
Kai Knudsen
Updated:
29 September, 2025
Here, medical equipment and measurements for assessing central hemodynamics are described. This includes the pulmonary artery catheter (PA catheter), PiCCO, NICO, LIDCO, and others. Normal values are presented in easily readable tables.
Hemodynamic Monitoring
Standard monitoring of hemodynamics during anesthesia includes non-invasive blood pressure measurement, pulse, ECG, and oxygen saturation. For unstable patients or major surgery, invasive blood pressure measurement via an arterial catheter and possibly central venous pressure (CVP) via a central venous catheter (CVC) is used.

For more advanced surgery or very unstable patients, extended monitoring of central hemodynamics is often required. The goal is to maintain stable circulation during and after surgery with fluid therapy that provides good tissue perfusion and adequate oxygen delivery to vital organs without overloading the heart.

Goal-directed fluid therapy is based on the so-called Frank-Starling mechanism. This means that the heart increases its contractile force when filled with a higher volume. Thus, when blood volume is increased by fluid infusion, cardiac output increases. However, the increase plateaus, after which cardiac output decreases if more volume is given.

Extended and improved monitoring allows for goal-directed fluid therapy with optimization of circulation and fluid balance. Previously, the standard in anesthesiology was a Swan-Ganz catheter (pulmonary artery catheter/PA catheter) with thermodilution technology, which allows continuous measurement of cardiac output (CO), central venous pressure (CVP), stroke volume (SV), and systemic vascular resistance (SVR). The PA catheter is relatively complex to insert and use, which is why it has been replaced in recent years by less invasive techniques that are somewhat simpler to use. Several different less invasive techniques are available for monitoring central hemodynamics, such as PiCCO, NiCO, LiDCO, Cardio-Q, and Vigileo. A number of clinical studies have shown better outcomes when circulation has been optimized during major bowel surgery with the help of extended central hemodynamics. Many of the new monitoring techniques are simpler to apply compared to traditional PA catheterization, but they involve certain approximations based on algorithms that introduce some sources of error and uncertainty in reliability. PA catheters are primarily used in cases of right heart failure or severe pulmonary hypertension.

Extended hemodynamic monitoring provides better opportunities for goal-directed fluid therapy and balanced anesthesia techniques. It is debated how much fluid is best to give during surgery, but it was already shown in the 1980s that patients with supranormal oxygen delivery values had better outcomes after surgery, which has later been confirmed in meta-analyses. Oxygen delivery depends on hemoglobin concentration, arterial oxygen saturation, and cardiac output. Cardiac output, in turn, depends on heart rate and stroke volume. Today, cardiac output is primarily optimized, not oxygen delivery. To get a better understanding of optimal oxygen delivery, metabolic parameters such as central venous oxygen saturation (SvO2), NT-ProBNP, and lactate must also be measured.

However, it should be noted that the patients studied by Shoemaker and others had a relatively low average age, making that group different from the often much older patients who are now frequently operated on in Swedish hospitals. It is likely that older patients tolerate fluid loading less well than younger and heart-healthy ones. It is reasonable to think that both too much and too little fluid can have negative effects on circulation and tissue perfusion. Edema in bowel anastomoses and internal organs in the abdomen and thorax such as the liver, pancreas, and lungs can have negative effects.

The goal is to optimize the heart’s stroke volume and thereby cardiac output instead of giving a fixed amount of fluid per unit of time, thereby ensuring good oxygen delivery to the tissue without excessive fluid administration. It is known that high pulse and high blood pressure over a long period are not good for circulation, just as too low blood pressure or restricted circulation to vital organs or splanchnic circulation is also not beneficial. Significant drops in blood pressure (>40% of systolic baseline) or tachycardia with cardiac ischemia are also not desirable. We always try to avoid hypoxia, blood pressure drops, tachycardia, and cardiac ischemia. Excessive inotropic treatment risks tiring out the heart with negative long-term effects, even if cardiac output can be maintained intraoperatively. Instead, we primarily try to optimize circulation with controlled fluid administration. The goal is to maintain normal central filling pressures, SaO2 >94%, SvO2 >70%, Hgb 8-10 g/dL, temp 37°C, and MAP at 60-100 mmHg (>65 mmHg). The target is a cardiac index (CI) above 3.0 l/min/m², global end-diastolic volume (indexed) (GEDI) above 700 ml/m², intrathoracic blood volume (ITBI) between 850-1000 ml/m², and global ejection fraction (GEF) >30%. Extravascular lung water (ELWI) should be below 10 ml/kg, and pulse pressure variations under 10% (SVV% and PPV%). Signs of good hemodynamics are stable and calm circulation with good peripheral circulation (fine capillary refill), good urine production, normal ST-T segment on ECG, fine blood gases including SvO2, and no lactate production. NT-ProBNP should be <450 ng/L.

In most anesthesia cases, basic measurements with invasive blood pressure, pulse, and CVP are relatively sufficient. Individual CVP measurements have low clinical value, but a balanced assessment of hemodynamics with arterial blood pressure, pulse, CVP, and clinical picture is often sufficient. Peripheral capillary refill in fingers and toes should be well-filled, and the finger pulp should be warm and pink. In cases of sepsis and peripheral vasoconstriction, patients are usually filled with colloids and crystalloids until CVP reaches a level between 8-12 mmHg, sometimes up to 15-20 mmHg, and then dilate the patient until good peripheral circulation is achieved. Urine output should be >0.5 ml/kg/hour. Elevated lactate should be decreasing when fluid administration is optimized, ideally under 4 mmol/L. However, it cannot be generalized that CVP should always be high; this must be individualized in goal-directed fluid therapy. In some types of surgery, low CVP appears to be an advantage, such as in liver surgery.
Goal-directed fluid therapy requires the ability to measure the hemodynamic effects of the administered fluid volume, often given as a fluid bolus, e.g., 250 ml saline over 5 min (or 200 ml colloid). This allows an assessment of whether the increased preload of stroke volume improves cardiac output and tissue perfusion (“fluid responsiveness”). Typically, the effects on stroke volume, cardiac output, and stroke volume changes or pulse pressure variations are measured. Simply measuring central venous pressure and blood pressure has been shown to be insufficient in several studies. The degree of response to fluid bolus gives an indication of where on the so-called Frank-Starling curve the patient is, i.e., what degree of optimal filling has been achieved. When preload is increased with intravenously administered fluid, stroke volume increases significantly more if the patient is dehydrated and is on the lower part of the Frank-Starling curve. In such cases, the arterial pressure curve also varies significantly with respiration. A single stroke volume value does not indicate whether the patient is fluid-optimized. Optimal filling requires repeated measurements and continuous measurement of cardiac output (CO) and central hemodynamics. Additional information can be obtained by measuring venous oxygen saturation SvO2, which should exceed 70%, and systemic vascular resistance (SVR), as an expression of afterload.
Stroke volume variations (SVV%) and pulse pressure variations (PPV%) can provide an idea of the physiological response to fluid therapy or pharmacological intervention. Preload corresponds to the filling of the heart’s ventricles immediately before a contraction. Preload can be estimated with GEDV, global end-diastolic volume (indexed) (GEDI) or intrathoracic blood volume (ITBI). Stroke volume variations (SVV% – stroke volume variation) and pulse pressure variations (PPV% – pulse pressure variation) primarily provide information about changes in preload (% SVV = SVmax-SVmin/SVmean). SVR (systemic vascular resistance) primarily provides information about changes in afterload.
The choice of minimally invasive technique varies between different clinics in Sweden and is largely governed by local routines and practices. However, much suggests that these techniques could be used much more frequently to optimize patients hemodynamically during and after surgery.
Hemodynamic normal values are listed below.
Hemodynamic Normal Values
| Abbreviation | Practical nomenclature | Parameter | Reference Values | Unit/Notice |
|---|---|---|---|---|
| CO | Cardiac Output | Cardiac Output | 4,0-8,0 | l/min |
| CI | Cardiac Index | Cardiac Output (index) | 3,0-5,0 | l/min/m2 |
| ScVO2 | Central Venous Saturation | Central Venous Oxygenation | 70-80 | % |
| DO2I | Oxygen Delivery (Indexed) | Oxygen Delivery Index | 400-650 | ml/min/m2 |
| VO2I | Oxygen Consumption (Indexed) | Oxygen Consumption Index | 125-175 | ml/min/m2 |
| GEDV | Global Enddiastolic Volume | Global Enddiastolic Volume | 900-1280 | ml. A measure of cardiac filling and contractility. Preload. |
| GEDI | Global Enddiastolic Volume (Indexed) | Global Enddiastolic Volume Index | 680-800 | ml/m2 . GEDV/BSA. |
| GEF | Global Ejection Fraction | Global Ejection Fraction | 25-35 | %. A measure of the emptying of the heart all four chambers. (4xVS/GEDV). Contractility. |
| ITBI | Intrathoracic Blood Volume (Indexed) | Intrathoracic Blood Volume Index | 850-1000 | ml/m2 |
| SV | Stroke Volume | Stroke Volume | 60-100 | ml/beat |
| SVI | Stroke Volume Index | Stroke Volume | 33-47 | ml/beat/m2 |
| SVV | Stroke Volume Variations | Stroke Volume Variations | < 10 | % A measure of preload. High value with hypovolemia (>15%). SVmax-SVmin/SVmean |
| PPV | Pulse Pressure Variations | Pulse Pressure Variation | < 10 | %. A measure of preload. High value with hypovolemia |
| SVR | Systemic Vascular Resistance | Systemic Vascular Resistance | 900-1400 | Dyn*s*cm-5*m2. Measures peripheral vascular tone, a measure of afterload. Low when the patient is vasodilated. |
| SVRI | Systemic Vascular Resistance (Indexed) | Systemic Vascular Resistance Index | 1700-2400 | Dyn*s*cm-5*m2 |
| CFI | Cardiac Function Indexed | Cardiac Function Index | 4,5-6,5 | 1/min |
| GEF | Global Ejection Fraction | Global Ejection Fraction | 25-35 | % |
| dPmx | Left Ventricular Contractility (Indexed) | Index of Left Ventricular Contractility | -/- | mmHg/s |
| LVSWI | Left Ventricular Stroke Work (Indexed). | Left Ventricular Stroke Work Index | 50-62 | gm/m2. A contractility measure. At low levels, it is likely that inotropic drugs are needed. |
| CPI | Cardiac Power Index | Cardiac Power Index | 0,5-0,7 | W/m2 |
| ELWI Index | Extravascular Lung Water (Indexed) | Extravascular Lung Water | 3,0-7,0 | ml/kg |
| PVPI | Pulmonary Vascular Permeability (Indexed) | Pulmonary Vascular Permeability Index | 1,0-3,0 | -/- |
PA Catheter Swan-Ganz
For more advanced anesthesia or very unstable patients, extended monitoring of central hemodynamics is often required beyond arterial pressure and CVP. The goal is to maintain stable circulation during and after surgery with fluid therapy that provides good tissue perfusion and adequate oxygen delivery to vital organs without overloading the heart. PA catheters are often used in patients with reduced heart function, especially in cases of right heart failure, pulmonary hypertension, or severe global failure. Since the 1970s, the standard in anesthesiology has been a Swan-Ganz catheter (PA catheter/pulmonary artery catheter) with thermodilution technology, allowing continuous measurement of cardiac output (CO), central venous pressure (CVP), stroke volume (SV), wedge pressure (PCWP), pulmonary artery pressure (PA pressure systolic/diastolic), and systemic vascular resistance (SVR). The PA catheter is a four-lumen catheter with a thermistor and an inflatable balloon at the distal end. The balloon allows the catheter to be carried by the blood flow and guided into the pulmonary artery. The thermistor is used for thermodilution technology to measure central hemodynamics.


With the thermodilution technique, the Stewart-Hamilton formula is used to calculate cardiac output according to CO = V(TB-TI) x K1 x K2/∫ ΔTB(t)dt. The denominator represents the area under the thermodilution curve. The technique can be used for intermittent calculations of cardiac output by injecting cold fluid, usually refrigerated saline. A specific amount of fluid (10-20 ml) is injected into the proximal CVP section of the PA catheter. The temperature change is recorded at the catheter tip, and cardiac output is calculated from the thermodilution curve, usually requiring an average of the area under the curve from three different measurements.
For continuous calculation of CO, an automatic method based on a heating filament on the catheter in the right atrium is used. With pulsed heating (0.05°C) in 15-second sequences, a thermodilution curve is created. Multiple cycles are required, usually over 3-6 minutes. The use of a PA catheter is the “golden standard” for calculating central hemodynamics and is the reference method for other less invasive methods.
Insertion of PA Catheter
The catheter is usually inserted under sterile conditions into the internal jugular vein (v. jug. int. dx) through an introducer that is first inserted into the vein over a guidewire. The balloon-equipped PA catheter is inserted through the introducer, and the distal balloon is inflated in the right atrium to be carried by the blood flow. The PA catheter is advanced through the right ventricle and into a loop in the pulmonary artery. The distal balloon is inflated when the catheter is 15-20 cm into the right atrium with air. The preformed curvature of the catheter is used to navigate the loop through the right ventricle and into the pulmonary artery. The catheter should be connected to a pressure transducer during insertion to monitor changes in the pressure curve as it passes through the right atrium and right ventricle and into the pulmonary artery (arteria pulmonalis). When in the ventricle, it is usually 35-45 cm from the skin surface, and the correct position in the pulmonary artery is reached at 45-55 cm. Once in the pulmonary artery, continue to a wedging position (“wedge position”). The systolic component will disappear, and the curve will resemble a CVP curve. Then, the balloon is released. The catheter position should be confirmed by X-ray. The wedge pressure (PCWP/wedge pressure) is approximately the same as the end-diastolic pressure in the left ventricle – LVEDP (left ventricular end-diastolic pressure), an expression of preload.


The PA catheter is relatively complex to insert and use, which is why it has been replaced in recent years by less invasive techniques that are simpler to use. Scientifically, the PA catheter has become somewhat controversial. There are several studies showing increased mortality among patients who received a PA catheter, as well as studies showing improved outcomes and studies that essentially show no difference between those who received and those who did not receive a PA catheter. Complications that may occur include cardiac arrhythmias, arterial punctures, pneumothorax, infections, pulmonary embolism, pulmonary infarction, vessel rupture, valve damage, and catheter knotting requiring surgical intervention to remove the catheter. However, when used correctly by experienced personnel, the technique usually has a very low complication rate. Another drawback is that once the catheter is in place, many still cannot handle the hemodynamic data obtained, risking the inability to benefit from the catheter. Therefore, when placing a PA catheter, it is important to carefully weigh the pros and cons. To utilize the PA catheter correctly, some experience is necessary. As an anesthesiologist, one should reasonably have inserted at least 20 to gain good competence and ideally place 10-25 per year.
Indications for PA Catheter
- Septic shock
- Major trauma
- Extensive multiple organ failure
- Right heart failure
- Pulmonary hypertension
- Severe heart failure not responding to initial treatment
- Liver transplantation
- Heart transplantation
- Other monitoring of central hemodynamics is considered insufficient
PA-Catheter Swan-Ganz
| Abbreviation | Practical nomenclature | Reference Values | Unit/Notice |
|---|---|---|---|
| CO | Cardiac Output | 4,0-8,0 l/min | SV x HR/1000. A measure of flow. |
| CI | Cardiac Index | 3,0-5,0 l/min/m2 | SV x HR/m2. A measure of flow. CI=CO/BSA |
| PA-pressure | PA pressure | 15-30 mmHg Syst: 20-30 mmHg Diast: 8-12 mmHg | Systolic pressure is generated by the right chamber in systole. Blood pressure in the pulmonary circulation. |
| PA-pressure average | Mean PA pressure | 10-20 mmHg | PA-pressure in the pulmonary circulation mean. |
| PCWP/PAOP | Pulmonary Capillary Wedge Pressure Pulmonary Occlusion Pressure | 5-15 mmHg | Corresponds to LVEDP, a measure for Preload. |
| SV | Stroke Volume | 50-110 ml/beat | Stroke Volume. CO/HR x 1000 |
| LVSWI | Left Ventricular Stroke Work Index | 50-62 gm/m2 | A contractility measure. At low levels, it is likely that inotropic drugs are needed. LVSWI=SVI(MPA-MRA) x 0,0136 |
| PVR | Pulmonary Vascular Resistance | 150-250 Dyn*s*cm-5*m2 | Corresponds to resistance in the pulmonary circulation. PVR=(MPAP-PAWP)x80/CO |
| PVRI | Pulmonary Vascular Resistance Index | 240-400 Dyn*s*cm-5*m2 | Corresponds to resistance in the pulmonary circulation. (indexed). |
| SVR | Systemic Vascular Resistance | 900-1400 Dyn*s*cm-5*m2 | Measures peripheral vascular tone, a measure of afterload. Low when the patient is vasodilated. |
| SVRI | Systemic Vascular Resistance Index | 1700-2400 Dyn*s*cm-5*m2 | Measures peripheral vascular tone, a measure of afterload. Low when the patient is vasodilated. |
| CaO2 | Arterial Oxygen Content | 18-20 ml/dl | The amount of oxygen bound to hemoglobin plus the unbound fraction |
| Mixed venous oxygen content | ScVO2 | 70% 13-16 ml/dl | A measure of DO2-VO2. Reflects CO. |
| Arterio venous O2-difference | CaO2-CvO2 | 4-5,5 ml/dl | Reflects oxygen consumption. High at oxygen debt. |
| DO2 | Oxygen delivery | 800-1000 ml/min | Oxygen delivery |
| VO2 | Oxygen consumption | 150-300 ml/min | Oxygen consumption |
PiCCO
Pulsion’s monitoring system PiCCO (Pulse Contour Continuous Cardiac Output) continuously measures central hemodynamics via the pulse contour method or intermittently via thermodilution. PiCCO measures and calculates the arterial pressure curve through connections and measurements from an arterial catheter and a central venous catheter.


PiCCO allows for the management of fluid balance and optimization of circulation in critically ill or hemodynamically unstable patients, often referred to as goal-directed fluid therapy.
Pulse contour analysis is based on the principle that the larger the stroke volume, the more blood volume accumulates on the arterial side, leading to greater variations in systole and diastole. Stroke volume is calculated from the systolic part of the pulse wave. Pulse pressure is proportional to stroke volume (SV) and inversely proportional to the compliance of the vascular bed. Pulse pressure variations change with changes in vascular tone and stroke volume. Vascular tone is difficult to measure and is therefore calculated based on algorithms that consider age, gender, ethnicity, and BMI. From these algorithms and pulse contour analysis, cardiac output and central hemodynamics are calculated. With PiCCO, one can measure cardiac output (CO), cardiac index (CI), global end-diastolic volume (GEDV), intrathoracic blood volume (ITBV), global ejection fraction (GEF), extravascular lung water (ELW), stroke volume variations (SVV%), and pulse pressure variations (PPV%). CO (cardiac output)/PCCO (pulse continuous cardiac output), systemic vascular resistance (SVR), and SVV are calculated from the pulse contour analysis. SVR is calculated using the formula (MAP-CVP)/CO.
Cardiac output determination with thermodilution technology is done by injecting an indicator (cold fluid) into the arterial catheter, where a thermistor records the temperature change along the blood flow. The cold fluid is injected centrally on the venous side, and the temperature change is measured peripherally on the arterial side via the PiCCO catheter. CO is calculated using a modified algorithm according to Stewart-Hamilton. CO, GEDV, ITBV, and EVLW are calculated by the module based on thermodilution determinations.
PiCCO Reference Values
| Abbreviation | Parameter | Reference Values | Unit/Notice |
|---|---|---|---|
| CO | Cardiac Output | 4,0-8,0 l/min | SV x HR/1000. A measure of flow. |
| CI | Cardiac Index | 3,0-5,0 l/min/m2 | SV x HR/m2. A measure of flow. CI=CO/BSA |
| GEDV | Global Enddiastolic Volume | 900-1280 ml | A measure of cardiac filling and contractility. Preload. |
| GEDI | Global Enddiastolic Volume Index | 680-800 ml/m2 | A measure of cardiac filling and contractility. Preload. GEDV/BSA. |
| ITBI | Intrathoracic Blood Volume Index | 850-1000 ml/m2 | A measure of cardiac filling in all chambers and in the pulmonary circuit. Higher at higher filling pressures. Preload. |
| GEF | Global Ejection Fraction | 25-35 % | A measure of emptying from all chambers. Contractility. (4xVS/GEDV). |
| ELWI | Extravascular Lung Water (Index) | 3-7 ml/kg | A measure of cardiac filling in the lungs. Higher at pulmonary edema. |
| SVV | Stroke Volume Variation | < 10 % | A measure of preload. Higher values at hypovolemi (>15%). SVmax-SVmin/SVmean |
| PPV | Pulse Pressure Variation | < 10 % | A measure of preload. Higher values with hypovolemia. |
| LVSWI | Left Ventricular Stroke Work Index | 50-62 gm/m2 | A measure of contractility. At low values there is need for inotropic drugs. |
| SVR | Systemic Vascular Resistance | 900-1400 Dyn*s*cm-5*m2 | Measures peripheral vascular tone, a measure of afterload. Low when the patient is vasodilated. |
| SVRI | Systemic Vascular Resistance Index | 1700-2400 Dyn*s*cm-5*m2 | Measures peripheral vascular tone, a measure of afterload. Low when the patient is vasodilated. |
PiCCO is based on measurements from two catheters: a central venous catheter and an arterial catheter, usually placed in the femoral artery. For the system to be reliable, a good arterial pressure curve is required, which can be challenging in cases of severe hypovolemia, vasoconstriction, or vascular occlusion. To obtain reliable flow data, PiCCO must be calibrated using a thermal indicator via the CVC (at least every 8 hours). The CVC should be a 3-lumen CVC. The arterial catheter is a special PiCCO catheter with a thermistor at the invasive end, which branches into an electronic segment and a fluid-filled segment that goes to a pressure dome. The electronic segment from the femoral catheter is connected to the PiCCO’s shared arterial pressure cable, which is also connected to the CVC. Connect the temperature sensor and the cord to the PiCCO module. The segment connected to the CVC provides electronic measurements from injections made centrally via the CVC for thermodilution. In adults, a cold injectate for calibration, typically 5-20 ml of sodium chloride, is used. The injectate is injected over seven seconds at the command of the PiCCO module.

Cardiac output is determined as CO, or continuously as PCCO or indexed values such as CI or CCI. SVI is stroke volume index, a measure of heart contractility. Intrathoracic blood volume (ITBV) is a measure of preload. Extravascular lung water (ELW and ELWI) is a measure of how wet the lung is, increasing with failure and pulmonary edema.
Extended hemodynamic monitoring provides better opportunities for goal-directed fluid therapy and balanced anesthesia techniques. It is debated how much fluid is best to give during surgery, but it was already shown in the 1980s that patients with supranormal oxygen delivery values had better outcomes after surgery, which has later been confirmed in meta-analyses. Oxygen delivery depends on hemoglobin concentration, arterial oxygen saturation, and cardiac output. Cardiac output, in turn, depends on heart rate and stroke volume. Today, cardiac output is primarily optimized, not oxygen delivery. To get a better understanding of optimal oxygen delivery, metabolic parameters such as central venous oxygen saturation (SvO2) and lactate must also be measured.
The goal is usually a cardiac index (CI) above 3.0 l/min/m², global end-diastolic volume (indexed) (GEDI) above 700 ml/m², intrathoracic blood volume (ITBI) between 850-1000 ml/m², and global ejection fraction (GEF) >30%. Extravascular lung water (ELWI) should be below 10 ml/kg, and pulse pressure variations under 10% (SVV% and PPV%). Signs of good hemodynamics include stable, calm circulation with good peripheral circulation (fine capillary refill), good urine production, normal ST-T segment on ECG, fine blood gases (normal BE) including SvO2, and no lactate production (<2 mmol/l).
Practical Instructions
Thermodilution/calibration is preferably done with 20 ml saline <8°C. Before calibration, a regular CVP measurement is performed. There should be 100 ml saline in the refrigerator in the medical rooms. Preferably place in an ice bath (ice packs in the patient kitchen, the temperature should ideally be <8°C). Luer-lock syringes are preferred. Press the “Start” button on the PiCCO module or “Main Menu Default” + “Cardiac Output”. A large menu should now appear on the screen. Check that the amount of 20 ml is entered. Connect the syringe with cold saline to the CVC. Press “Start CO measurement”. It should then say “Stable baseline, inject now”. The injection should start within 20 seconds, should proceed at a steady pace, and should not take more than 8 seconds. Check that the measurement has received a green checkmark “cal” = ok. Press “Start CO measurement” for a new measurement and repeat as above. Three approved measurements are sought. If any value/curve deviates significantly or is rejected by the machine, just press the green curve box (it will turn red) and it will not be included in the calibration. You have 15 minutes to complete all your thermodilutions. When you have three good measurements, press “Save CO & calibrate CCO”. The green curve boxes will then turn gray-green and locked, and question marks will disappear from the continuous values on the screen. Calculations are performed by pressing the “hemodynamic calculations” button (at the bottom if the previous menu is still open, otherwise, you need to navigate through the menu). To obtain indexed values, body weight and height must be entered. CVP is needed for SVR (resistance) calculation and is entered manually. Then press “perform calculations” and all the numbers will appear in the table. Recalibration should be done every 8 hours.
PiCCO Decision Tool. Pulse Contour Analysis
Click the image to download the PDF file

NiCO
NiCO measures central hemodynamics non-invasively via the airways – Non-Invasive Cardiac Output. NiCO requires a closed breathing system, which is why this method is usually used on sedated or anesthetized patients in a ventilator. NiCO can measure cardiac output based on changes in CO2 concentration in exhaled air caused by a controlled period of rebreathing in a closed loop system. NiCO uses partial CO2 rebreathing and a modified Fick equation to calculate cardiac output and central hemodynamics by sampling CO2 in exhaled air. The system includes a CO2 sensor (measuring with infrared light), a flowmeter (“differential pressure pneumotachymeter”), an extensible rebreathing gas loop (tube loop), and a pulse oximeter. Therefore, no CVC is needed for this system.

Cardiac output can be calculated according to Fick’s principle, based on the relationship between oxygen consumption (VO2) and the arteriovenous oxygen difference (AVDO2). Through mathematical calculations, Fick’s principle can also be applied to measurements of CO2 production with and without rebreathing. Venous CO2 can be calculated from the difference in CO2 concentration in inhalation and exhalation with and without rebreathing. The method is based on the calculation of cardiac output using the formula CO = VO2/CaO2-CvO2, which can be used for CO2 production in accordance with CO = VCO2/CvCO2-CaCO2 with (r) and without rebreathing (nr). By VCO2nr/CvCO2nr– CaCO2nr= VCO2r/CvCO2r-CaCO2r, the formula can be written as CO = ΔVCO2/ΔetCO2 x S. S is a coefficient for the slope of the CO2 dissociation curve.
The tube loop with a CO2 meter and a flowmeter is connected to the patient’s closed breathing system. During a three-minute rebreathing cycle, the difference in CO2 concentration in exhaled air for end-tidal CO2 before and after the rebreathing cycle is measured. A loop system for rebreathing allows an induced increase in CO2 production followed by a decrease in CO2 production. The difference is used to calculate cardiac output. CO 2 production (VCO2, ml/min) is calculated from the difference in inhaled and exhaled air, while the amount of CO2 (CaCO2, ml/100 ml blood) is estimated from etCO2 (mmHg). NiCO utilizes the difference in etCO2 and CO2 elimination to calculate cardiac output. Delta VCO2 (CO2 production) is calculated by measuring in normal breathing and after rebreathing (VCO2nr-VCO2r = ΔVCO2). Delta CaCO2 can be approximated by multiplying etCO2 by a factor (S) for the slope of the CO2 dissociation curve, which is linear between 15 and 70 mmHg in CO2 partial pressure (2-9.3 kPa).
CO2 production is calculated from the product of CO2 concentration and air flow during a breathing cycle, and CaCO2 is obtained from etCO2 and the CO2 dissociation curve.
NiCO calculates blood flow (COeff) through the perfused lung, i.e., only those parts of the pulmonary circulation that are not shunt flow. Shunt flow (COshunt) must be added to show the entire cardiac output (CO = COeff + COshunt). CO-shunt is calculated automatically from the isoshunt diagram. Cardiac output is the sum of COeff and COshunt. To use NiCO, stable conditions are required regarding cardiac output, metabolism, minute ventilation, arterio-alveolar CO2 difference, no CO2 recirculation, and a correct shunt estimate. NiCO is unsuitable for light sedation, spontaneous breathing, high ICP (due to the risk of CO2 retention), and hypercapnia.
NiCO Reference Values
| Abbreviation | Parameter | Reference Values | Unit/Notice |
|---|---|---|---|
| CO | Cardiac Output | 4,0-8,0 l/min | SV x HR/1000. A measure of flow. |
| CI | Cardiac Index | 3,0-5,0 l/min/m2 | SV x HR/m2. A measure of flow. CI=CO/BSA |
| SV | Stroke Volume | 60-100 ml/beat | ml/beat The amount of blood ejected from the left ventricle in every heartbeat. |
| SVI | Stroke Volume Index | 33-47 ml/beat/m2 | ml/beat. The amount of blood ejected from the left ventricle in every heartbeat/BSA. |
| HR | Heart Rate | 60-90 beats/min | Pulse rate, beats/min |
| Cdyn | Dynamic Compliance | 0-500 ml/cm H2O | The volume that the lung expands for a given pressure. |
| ETCO2 | Endtidal Carbon Dioxide | 0-20 kPa | Maximum CO2 plateau at the end of the breathing cycle, end tidal. |
| Insp CO2 | Inspired Carbon Dioxide | 0,4-6,7 kPa | |
| PCBF | Pulmonary Capillary Blood Flow | 0,5-20 l/min | Blood flow through ventilated parts of the lung |
| VCO2 | Carbon Dioxide Elimination | 0-3000 ml/min | Exhausted amount of carbon dioxide per minute. |
| Vte | Expired Tidal Volume | 200-3000 ml | Exhausted amount of air per breath. |
| PiP | Peak Inspiratory Pressure | 0-120 cm H2O | Peak Pressure |
LiDCO
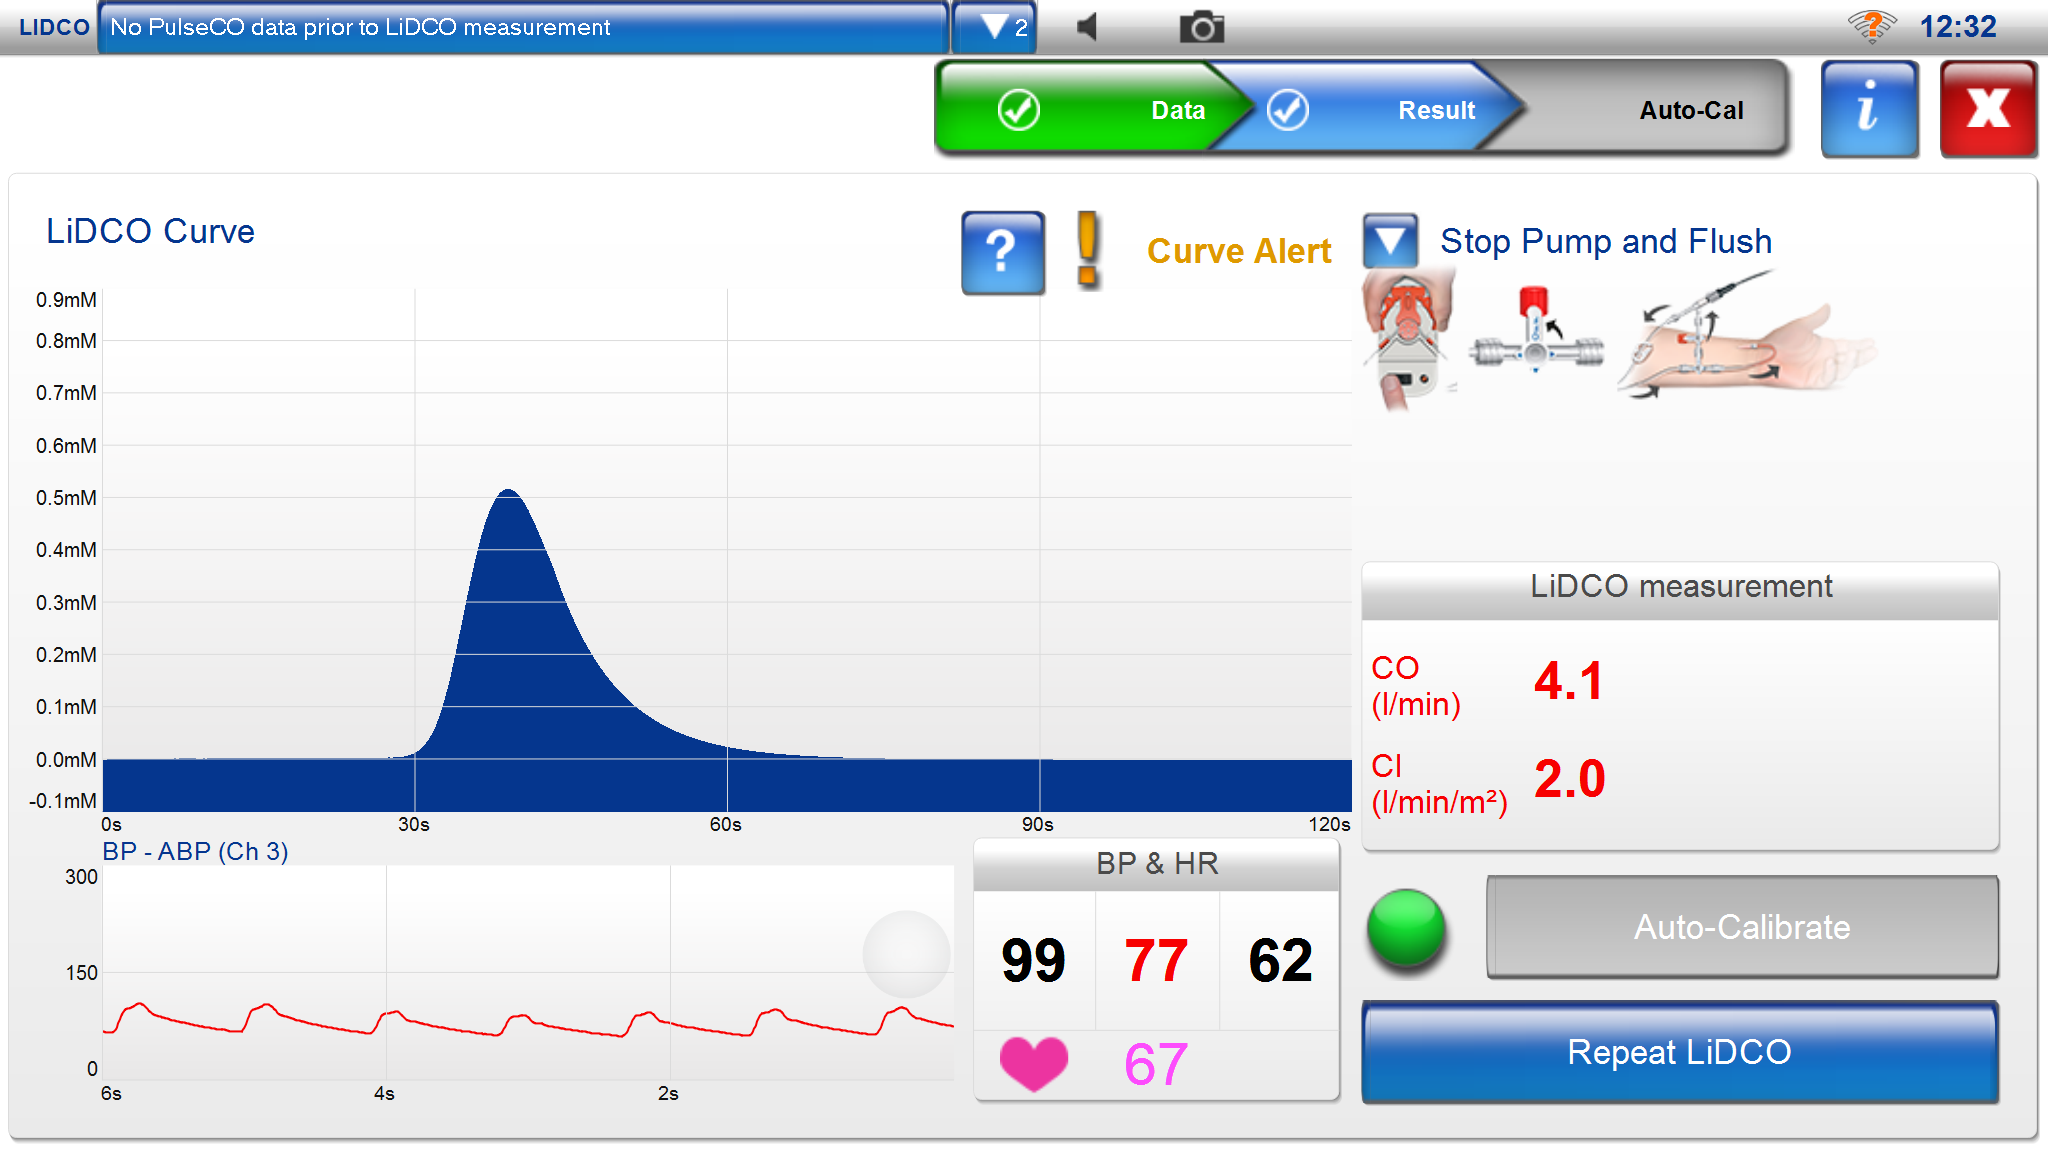
LiDCO’s monitoring system (LiDCO rapid/LiDCO plus) measures central hemodynamics via the arterial pressure curve and allows for fluid balance management and optimization of circulation in critically ill or hemodynamically unstable patients. LiDCO uses lithium calibration in the LiDCO plus system and without lithium calibration with direct analysis of the arterial pressure curve in LiDCO rapid. Goal-directed fluid therapy can be achieved either with LiDCO rapid, mainly intended for temporary use in the operating room, or LiDCO plus, primarily intended for continuous use in the ICU.

With LiDCO rapid, one can connect to the arterial pressure curve via an arterial catheter and obtain arterial pressure (SP, DP, MAP), heart rate, cardiac output (CCO), stroke volume (SV), stroke volume variations (SVV%), and pulse pressure variations (PPV%). Stroke volume variations (SVV% – stroke volume variation) and pulse pressure variations (PPV% – pulse pressure variation) primarily provide information about changes in preload (% SVV = SVmax-SVmin/SVmean.). LiDCO uses an algorithm to calculate central hemodynamics called the PulsCO algorithm.
LiDCO plus can measure continuous values of cardiac output (CCO), stroke volume (SV), stroke volume variations (SVV%), and pulse pressure variations (PPV%) with lithium calibration (lithium dilution technique). A lithium-sensitive electrode is connected to the arterial catheter during calibration. Cardiac output is calculated by Q = Li x 60/A x (1-PCV*). Stroke volume variations (SVV%) and pulse pressure variations (PPV%) provide an idea of the physiological response to fluid therapy or pharmacological intervention. Stroke volume variations are calculated from the volume of the arterial pressure curve (area), while pulse pressure variations are calculated from amplitude changes in the arterial pressure curve. SVR (systemic vascular resistance) primarily provides information about changes in afterload. During lithium calibration, lithium is injected for external calibration of pulse contour analysis. Lithium is injected into a peripheral or central vein. A graphic lithium analysis is performed on the patient’s arterial blood, drawn in a specific amount from an existing arterial catheter. This analysis calculates the lithium washout curve over time. The curve resembles a thermodilution curve used with PA catheters and provides a determination of cardiac output. The lithium dilution technique has good correlation with the thermodilution technique.
LiDCO provides continuous monitoring of central hemodynamics with minimally invasive equipment. LiDCO is validated against Swan-Ganz catheter-measured central hemodynamics. The LiDCO rapid monitor can also display continuous non-invasive blood pressure (non-invasive CNAP) and wakefulness registration with BIS. LiDCO rapid is connected via an electronic cable to the monitor or device that records arterial blood pressure. For each patient registration, a SmartCard login is required in the LiDCO rapid monitor, which is patient-specific and fee-based.
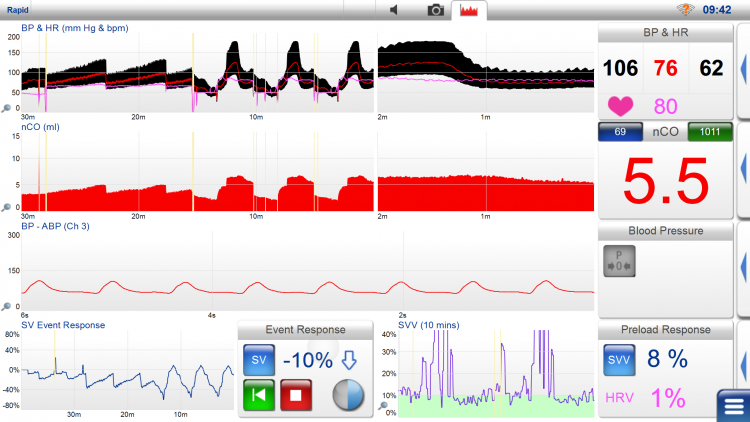
LiDCO monitor displays arterial pressure (SP, DP, MAP), heart rate, CO/CI, SV/SVI, SVV%, and PPV%. If needed, it can also display BIS and BIS trends. Stroke volume is shown as nSV in ml, along with intermittently recorded values, e.g., every other minute. Volume replacement changes are recorded as percentage changes in stroke volume (SV Event Response), providing an idea of volume status and can be used to guide fluid therapy towards optimal oxygen delivery. A common procedure is to administer a fluid bolus of 250 ml saline in less than 5 minutes and evaluate changes in stroke volume. A positive response is interpreted as more than a 10% increase in SV (fluid responsive). If a positive response is observed, another 250 ml saline bolus is given until the stroke volume increase is saturated. If stroke volume does not increase by more than 10%, the patient is “fluid non-responsive” and lies higher up on the Starling curve with a higher preload. Stroke volume is checked every 15 minutes.
The goal is to maintain SaO2 >94%, Hgb 8-10 g/dL, temp 37°C, and MAP at 60-100 mmHg.
LiDCO uses an algorithm to calculate cardiac output. In this algorithm, the pulse is multiplied by a value from the standard deviation of changes in the arterial pressure curve measured in mm Hg. This standard deviation has been approximated as the stroke volume, which, when multiplied by the heart rate, gives the cardiac output. This measure is also multiplied by a factor that compensates for changes in vascular tone measured in the arterial pressure curve.
Lithium calibration is not suitable for lithium-treated patients. It should also not be used in pregnant women in the first trimester. Certain muscle relaxants, vecuronium, pancuronium, atracurium, can affect the measurement.
*PCV= packed cell volume. A= area under the lithium dilution curve.
Cardio-Q
Cardio-Q continuously measures central hemodynamics via esophageal Doppler technology (transesophageal Doppler), which measures blood flow velocity in the aorta using an ultrasound probe inserted into the esophagus. The probe has a Doppler transducer at the tip, directed towards the descending part of the thoracic aorta. The probe uses a 4 MHz wave for continuous Doppler analysis or 5 MHz for a pulse wave analysis, utilizing the relationship that cardiac output Q = v x A (v = Df x s/2 x f x cosθ).


In M-mode, the ultrasound wave passes through the aorta, while in Doppler mode, it measures the circumference of the aorta. By measuring the flow and area, cardiac output can be calculated. The probe usually requires a sedated and mechanically ventilated patient who lies still, with the probe inserted into the esophagus through the mouth, similar to a nasogastric tube. The optimal position is at the level of Th5-Th6. The probe must then be rotated to capture an optimal signal from the aorta, so it can be relatively sensitive to rotations, slips, and twists. The person inserting the probe must adjust the depth, position, and rotation. Cardiac output is calculated from the diameter of the aorta, the distribution of cardiac output to the aorta, and the measured blood flow signal. A suboptimal position tends to underestimate cardiac output. Cardio-Q has shown good agreement with PA catheters for determining cardiac output in several studies, with up to 86% correlation. This technique has mainly been effective when hemodynamic changes have occurred intraoperatively and the probe has remained in place. The advantage of this technique is that it is non-invasive and easy to apply. Changes in intraoperative hemodynamics are more reliable than absolute values of central hemodynamics. Sources of error include the fact that the flow in the descending aorta only accounts for about 70% of cardiac output. Measurement errors can arise from measured area, mean velocity, and angle against the aorta. Another drawback is that diathermy interferes with the measurement, and the probe may need to be repositioned during the procedure. Cardio-Q allows for the management of fluid balance and optimization of circulation in critically ill or hemodynamically unstable patients, often referred to as goal-directed fluid therapy.
With Cardio-Q, one can measure cardiac output (CO), cardiac index (CI), stroke volume (SV), corrected flow time (FTc), stroke volume distance (SD), pulse (HR), and peak flow velocity in the aorta (PV).
Cardio-Q Reference values
| Abbreviation | Parameter | Reference Values | Unit/Notice |
|---|---|---|---|
| CO | Cardiac Output | 4,0-8,0 l/min | SV x HR/1000. A measure of flow. |
| CI | Cardiac Index | 3,0-5,0 l/min/m2 | SV x HR/m2. A measure of flow. CI=CO/BSA |
| SD | Stroke Distance | 4-7 cm (?) | The distance each stroke volume is ejected into each heartbeat in aorta. |
| SV | Stroke Volume | 60-100 ml/beat | The volume of blood that is ejected into each heartbeat into aorta. |
| SVI | Stroke Volume Index | 33-47 ml/beat/m2 | The volume of blood that is ejected into each heartbeat into aorta./BSA. |
| FTc | Flow Time Corrected | 330-360 ms | The time of the flow during systole corrected for heart rate. A low value for hypovolemia. High value in vascular dilation. |
| PV | Peak Velocity | 90-120 cm/s for a 20-year old. 70-100 cm/s for a 50-year old. 50-80 cm/s for a 70-year old. | A measure of cardiac contractility. |
| HR | Heart Rate | 60-90 beats/min | Pulse rate, beats per minute. |
HemoSphere Advanced Monitor
Edwards Life Sciences offers systems that can monitor central hemodynamics through the arterial pressure curve (formerly: Vigileo), as well as through Swan-Ganz PA catheter and Edwards oximetric CVC. A new monitoring device called HemoSphere Advanced Monitor provides a good visual overview of central hemodynamics with a clear color display that can show continuous central hemodynamic measurements including SvO2, SV, CO, and CI (see the chapter on PA catheters). When connected to a Swan-Ganz PA catheter, one gets a complete overview of central hemodynamics. Edwards oximetric CVC allows for continuous measurement of mixed venous oxygen saturation (SvO2).
HemoSphere Advanced Monitor can measure central hemodynamics via the arterial pressure curve and provides opportunities for fluid balance management and circulation optimization in critically ill or hemodynamically unstable patients. This system offers good possibilities for achieving goal-directed fluid therapy. With HemoSphere, one can choose to connect only to the arterial pressure curve and obtain cardiac output (CCO), stroke volume (SV), and stroke volume variations (SVV), or also insert a central venous catheter (FloTrac) and obtain systemic vascular resistance (SVR). Stroke volume variations (SVV – stroke volume variation) provide information about changes in preload. (% SVV = SVmax-SVmin/SVmean.) SVR provides information about changes in afterload.
HemoSphere provides continuous monitoring of central hemodynamics with minimally invasive equipment. The catheter-based equipment used is called the FloTrac sensor and PreSep (or PediaSat) oximetric catheters, providing hemodynamic information on a single monitor. Together with the FloTrac sensor, continuous central hemodynamic information is provided with automatic calculations of cardiac output (CCO), stroke volume (SV), stroke volume variations (SVV), and systemic vascular resistance (SVR). SVR calculations require CVP from a central venous catheter. With PreSep or PediaSat oximetric catheters, continuous information on central venous oxygen saturation (ScvO2) is also obtained. These catheters are inserted similarly to a central venous catheter. The FloTrac sensor uses the arterial pressure curve from an existing peripheral arterial catheter, usually from the radial artery. The sensor automatically performs self-calibration, considering vascular tone (compliance and resistance), and calculates current parameters every 20 seconds. HemoSphere is validated against Swan-Ganz catheter-measured central hemodynamics.
HemoSphere monitor displays CO/CI, SV/SVI, SVV, and SVR/SVRI.
The FloTrac sensor uses an algorithm to calculate cardiac output. In this algorithm, the pulse is multiplied by a value from the standard deviation of changes in the arterial pressure curve measured in mm Hg. This standard deviation has been approximated as the stroke volume, which, when multiplied by the heart rate, gives the cardiac output. This measure is also multiplied by a factor that compensates for changes in vascular tone measured in the arterial pressure curve.


Disclaimer:
The content on AnesthGuide.com is intended for use by medical professionals and is based on practices and guidelines within the Swedish healthcare context.
While all articles are reviewed by experienced professionals, the information provided may not be error-free or universally applicable.
Users are advised to always apply their professional judgment and consult relevant local guidelines.
By using this site, you agree to our Terms of Use.
