Author:
Kai Knudsen
Updated:
27 August, 2025
Viscoelastic testing, a.k.a., thromboelastography or rotational thromboelastometry (ROTEM™), is a method of analyzing clot kinetics and mechanical properties to better guide the management of severe hemorrhage. This chapter explains ROTEM (Thromboelastometry), TEG, and Multiplate, focusing on their principles, clinical applications, and use in guiding hemostatic therapy. Here, graphical instruments for illustrating the entire coagulation profile in ROTEM and platelet function in Multiplate are described. Various components in ROTEM are reviewed with descriptions of different parts of coagulation, as well as normal values and therapeutic values during antithrombotic treatment as read in Multiplate.
- ROTEM Thromboelastogram (TEG)
- Numerical Values in Rotem
- Bleeding Algorithm Based on Thromboelastogram Results
- Normal Thromboelastogram
- TEG with Thrombocytopenia
- TEG with Fibrinogen Deficiency
- TEG with Increased Fibrinolysis
- TEG with Increased Heparin Activity
- Multiplate – Platelet Function Analysis
- TRAP Test
- ASPI Test
- ADP Test
- Antiplatelet Drugs in Multiplate
- Reference Interval in Multiplate
ROTEM Thromboelastogram (TEG)
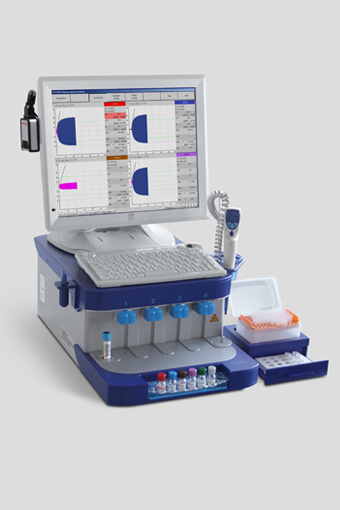
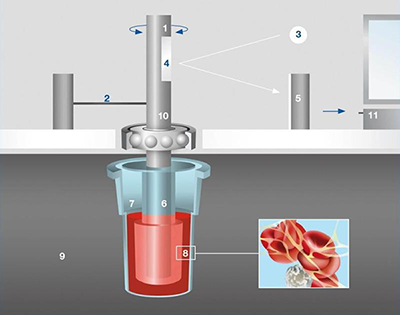
Thromboelastogram (TEG) is a viscoelastic analysis method that in vitro graphically illustrates the entire coagulation process in real-time (shows global hemostasis). TEG provides an overview of how blood coagulates during fibrin polymerization and shows the interaction between platelets, fibrin, and fibrinolysis. Thromboelastogram is also referred to as ROTEM (Rotation Thromboelastometry), NATEM, or TEG (Thromboelastography). Whole blood from the patient is placed in an analysis cup in a thromboelastograph for analysis (see image). A mechanical rotating sensor is dipped into the blood to detect hemostasis by measuring the reduction in viscoelasticity that occurs in the clot. Typically, 0.36 ml of blood is transferred to an analysis cup and placed in the thromboelastograph. The blood should be analyzed within 3 minutes after sampling, preferably immediately.
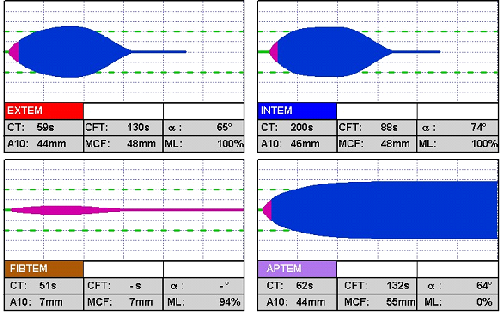
The thromboelastograph draws a curve as the blood coagulates, and the graph becomes thicker as more coagulation occurs. A straight line indicates no coagulation. Within 5-10 minutes, an indication of current hemostasis is provided, guiding appropriate treatment for coagulation disorders. The result is interpreted through a graphical reaction curve and numerical values. By adding various reagents, further analyses of the coagulation process can be performed as needed, with the standard analysis referred to as Natem. Sub-analyses beyond Natem include Extem, Fibtem, Intem, Aptem, and Heptem.
Natem
Provides a classic thromboelastogram of whole blood without additives. It offers a graphical analysis of global hemostasis.
Extem
Contains an addition of a tissue activator that provides information similar to PT/INR. It analyzes the coagulation cascade when tissue factor (TF) binds to FVII through activation via the “extrinsic pathway.”
Fibtem
Uses cytochalasin D, a platelet inhibitor that blocks platelets’ contribution to coagulation, allowing analysis of fibrinogen’s role in the coagulation process.
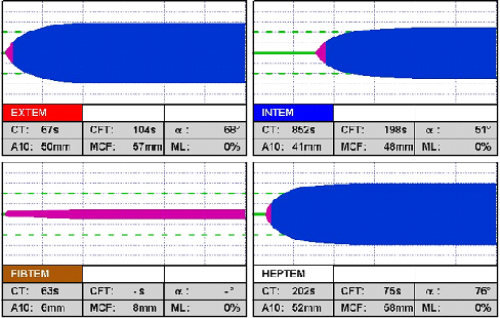
Intem
Contains phospholipids and ellagic acid as coagulation activators. Reflects coagulation activation via the “intrinsic pathway.” Intem provides an analysis result similar to a-PTT and is the sub-analysis most similar to Natem.
Aptem
Similar to Extem but can identify increased fibrinolysis through the addition of a fibrinolysis inhibitor, reversing TEG changes.
Heptem
Used for heparinase analysis when there is suspicion of the presence of heparin analogs in the blood that impair coagulation. These analogs can be exogenously or endogenously introduced. When heparinase is added to the analysis cup, these analogs are broken down, and coagulation is fully or partially normalized. Heptem can be combined with Intem to distinguish between heparin effect and coagulation factor deficiency.
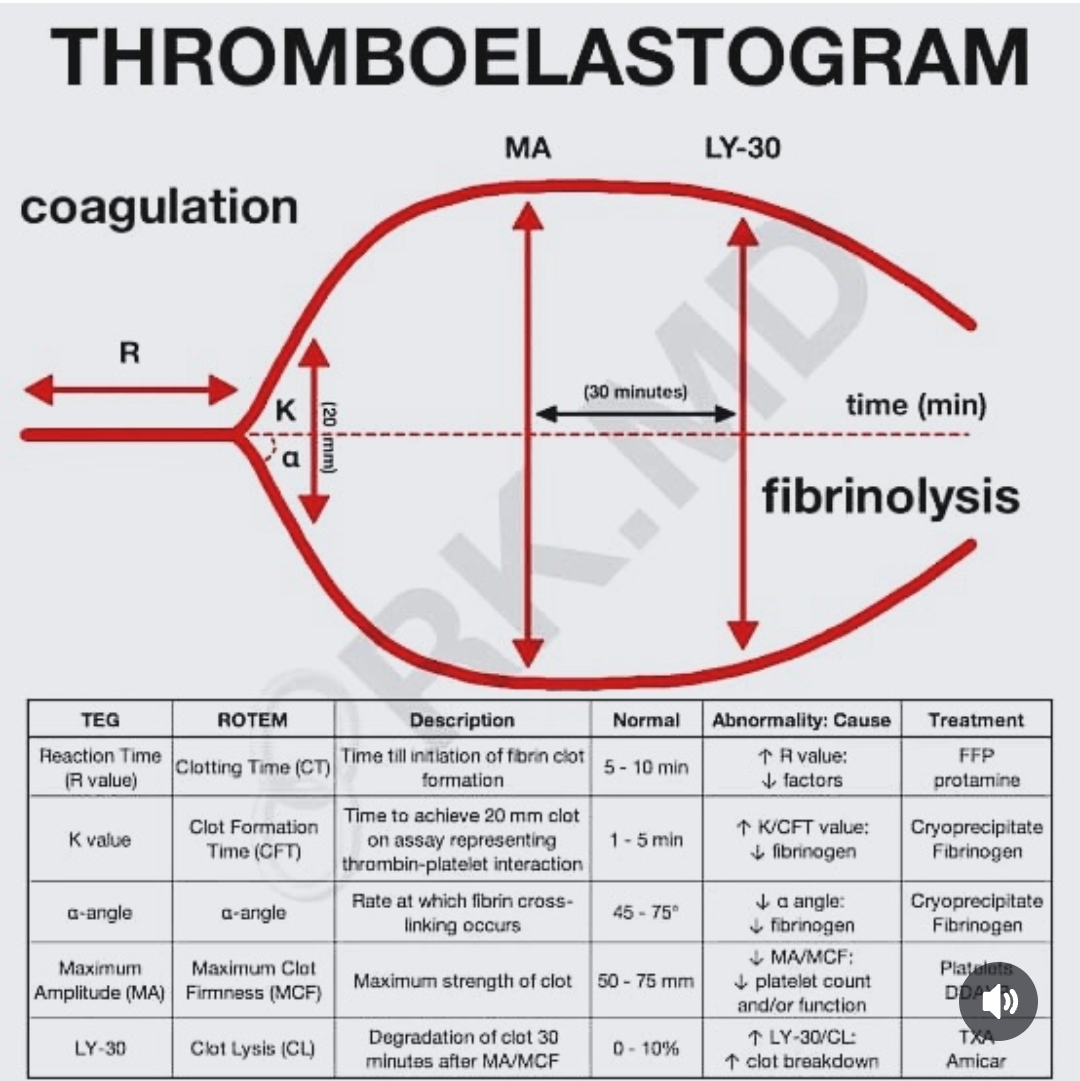
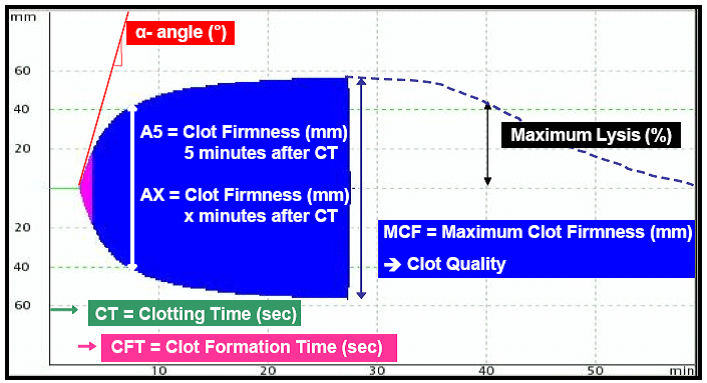
Numerical Values in Rotem
Several numerical values can be read from a thromboelastogram. When analyzing a thromboelastogram, the findings are always related to standard laboratory values reflecting coagulation, such as PT/INR, a-PTT, PLT, and fibrinogen.
- CT(s) is Clotting Time measured in seconds, normally 300-1000 seconds. It reflects the time from the start of the measurement until the beginning of coagulation, with a minimum width of 2 mm in the diagram. CT is prolonged during heparin treatment or with a deficiency of coagulation factors. a-PTT is prolonged with a long CT.
- Alpha angle (a-angle) reflects the speed of clot formation. It is increased in hypercoagulation and decreased in the presence of coagulation factor deficiencies.
- CFT(s) is Clotting Formation Time measured in seconds. It measures the coagulation time in seconds until the thromboelastogram reaches a width of 20 mm. CFT is normally 150-700 seconds. During this period, fibrin formation and clot stabilization occur with platelets and FVIII.
- Amplitude of the thromboelastogram is measured in mm at a given time point (AX or A5). A5 is the amplitude after 5 minutes. The amplitude provides a measure of clot quality, where platelet function is essential. Low amplitudes are seen in thrombocytopenia or low fibrinogen levels. In fibrinolysis, the amplitude gradually decreases.
- MCF (Maximum Clot Firmness) is measured in mm and reflects the quality of the clot. Normal values range between 40-65 mm.
- ML (Maximum Lysis) reflects fibrinolysis. It should normally be less than 15% after 1 hour. It is higher, for example, in increased fibrinolysis and DIC.
Bleeding Algorithm Based on Thromboelastogram Results
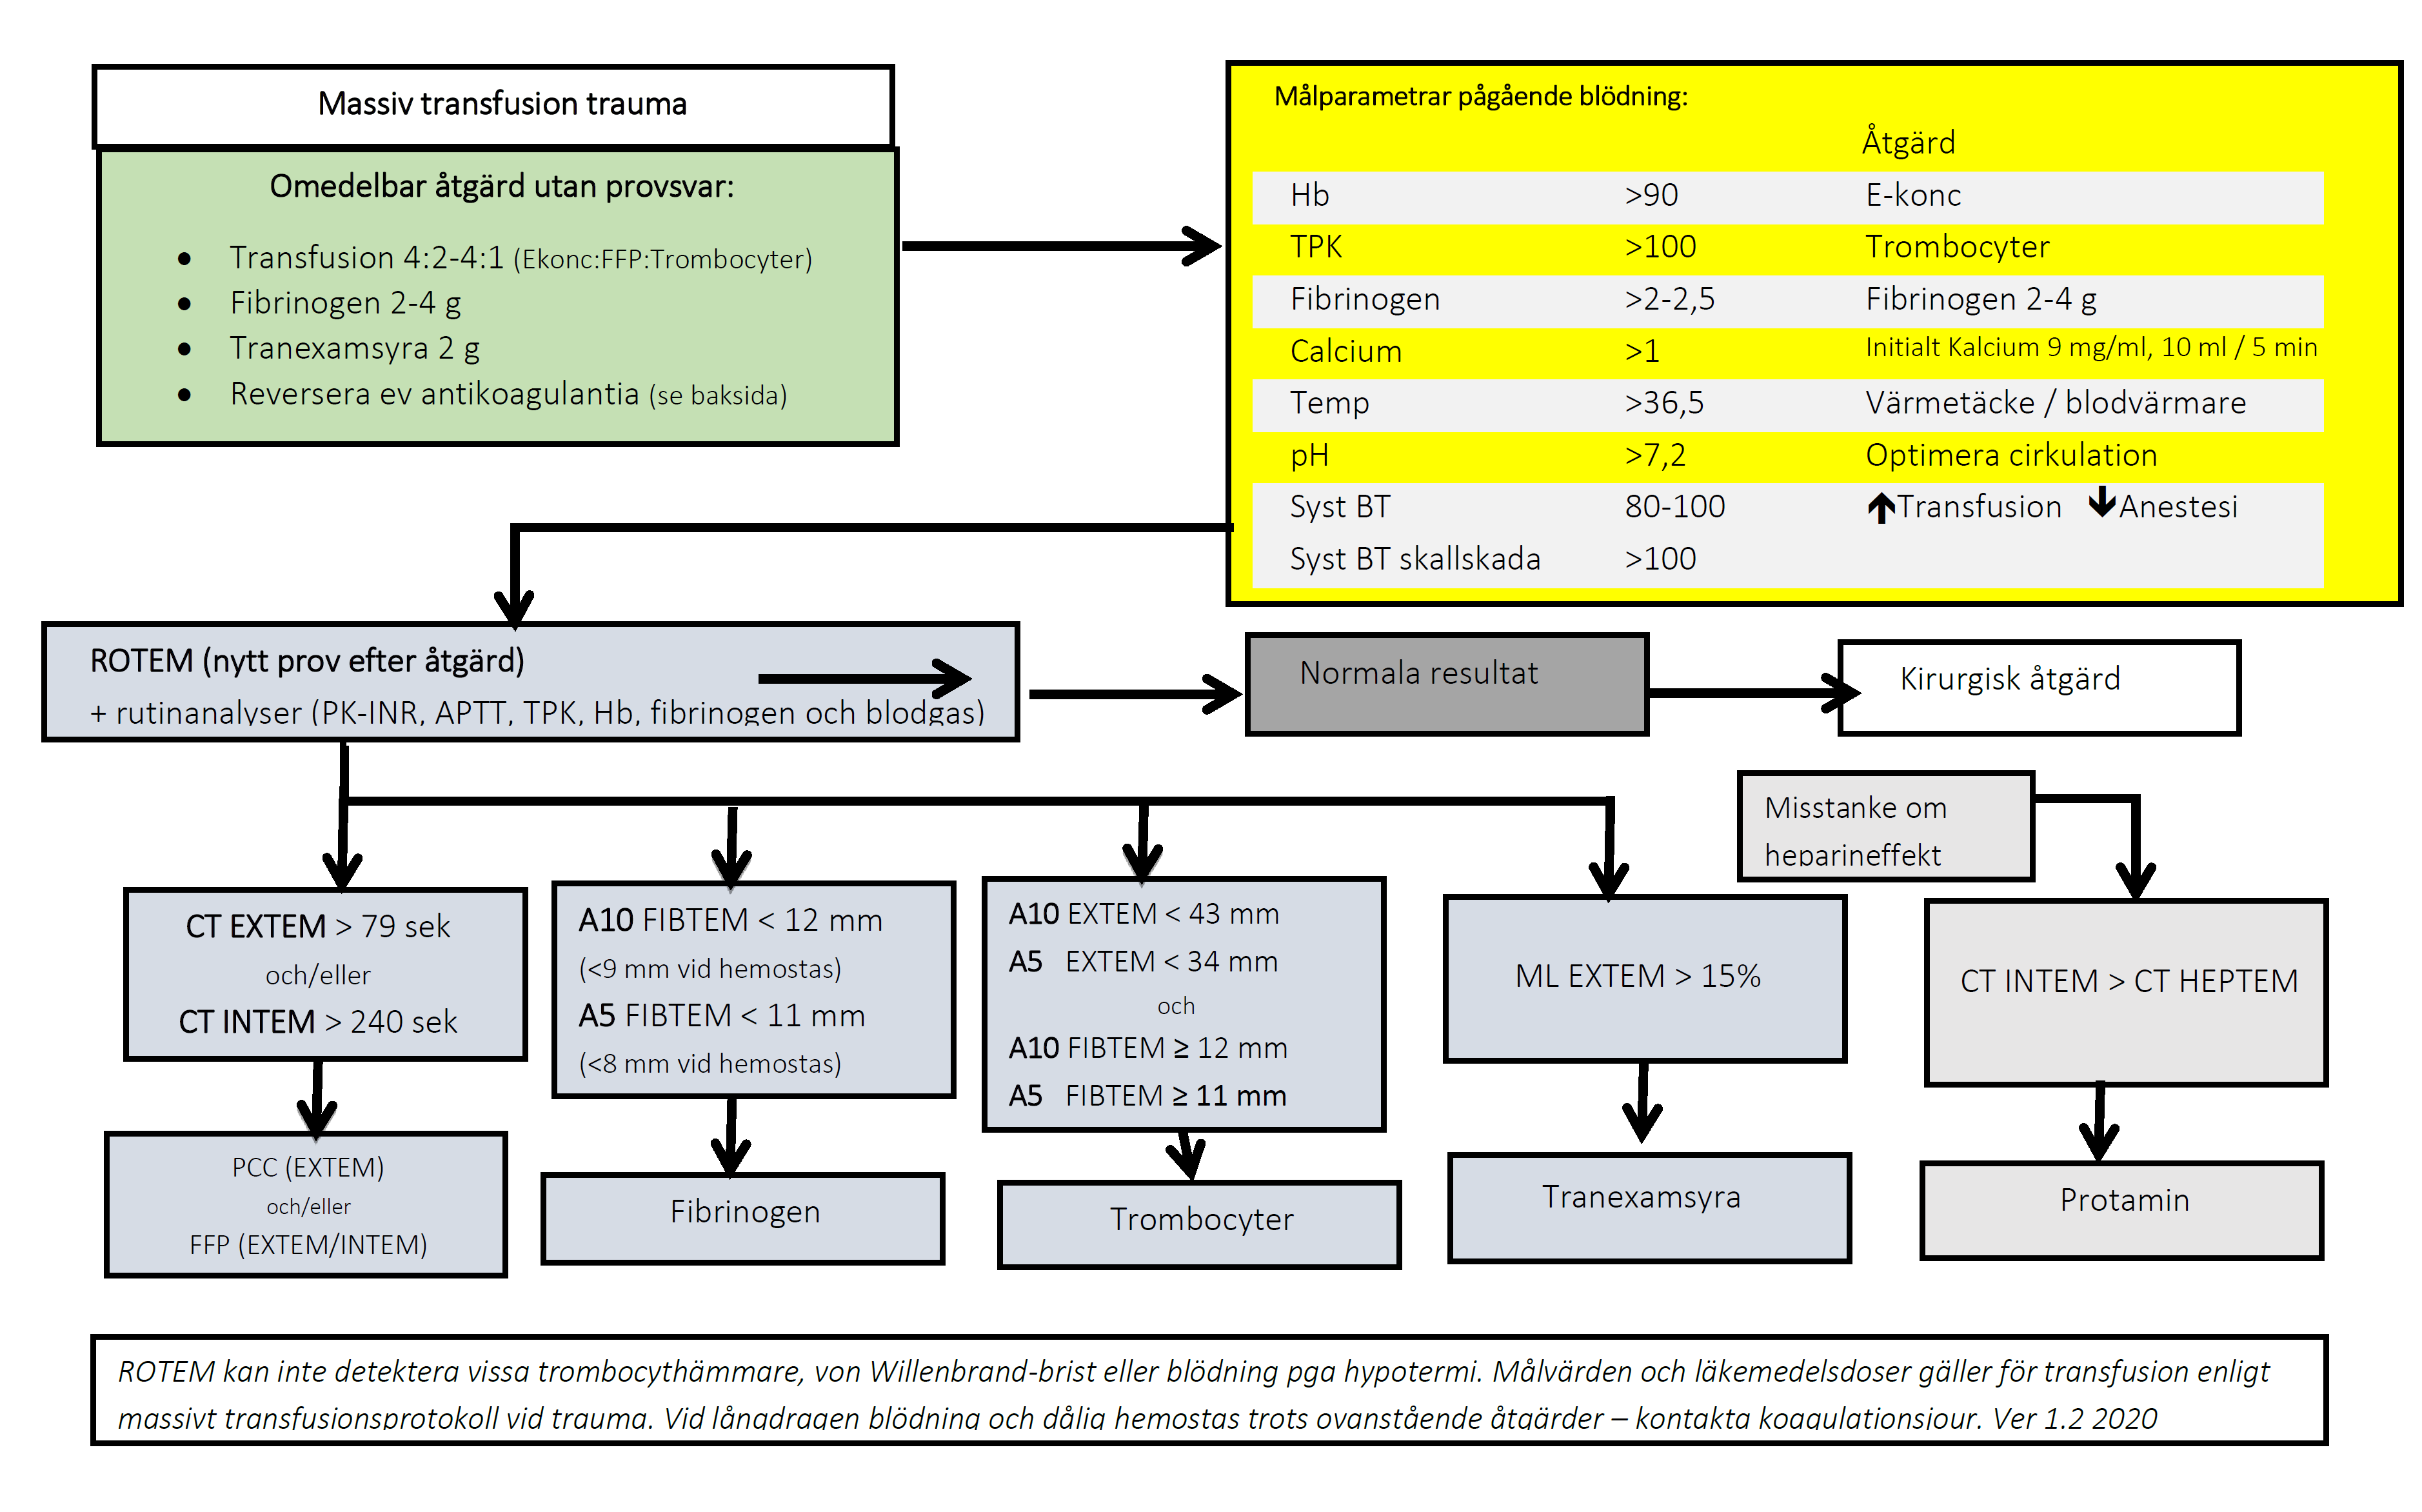
Normal Thromboelastogram
TEG with Thrombocytopenia
TEG with thrombocytopenia (Natem = C). The TEG curve has an extended starting time and a narrow appearance with low amplitude. Both Extem, Intem, and Aptem take on a narrower appearance.
- A10 EXTEM < 43 mm. A5 EXTEM < 34 mm
- A10 FIBTEM > 12 mm. A5 FIBTEM > 11 mm
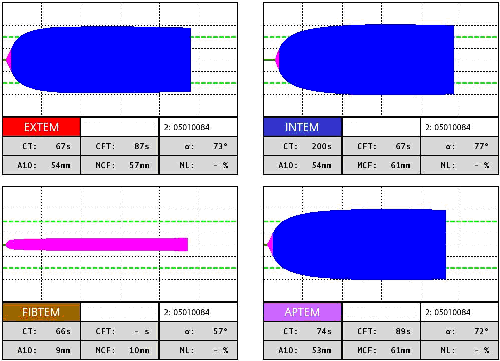
TEG with Fibrinogen Deficiency
Fibtem takes on a distinctly narrow appearance with low amplitude. Intem has a lower alpha angle than normal.
- A10 < 12 mm
- A5 < 5 mm
TEG with Increased Fibrinolysis
TEG with increased fibrinolysis (D). The TEG curve initially has normal amplitude but then quickly narrows as the clot lyses.
- ML > 15%
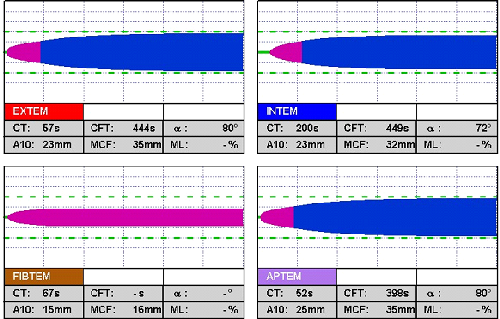
TEG with Increased Heparin Activity
TEG with increased heparin activity. Intem and Natem have an extended starting time. This effect can be reversed with a fibrinolysis inhibitor.
- CT INTEM > CT HEPTEM
Multiplate – Platelet Function Analysis
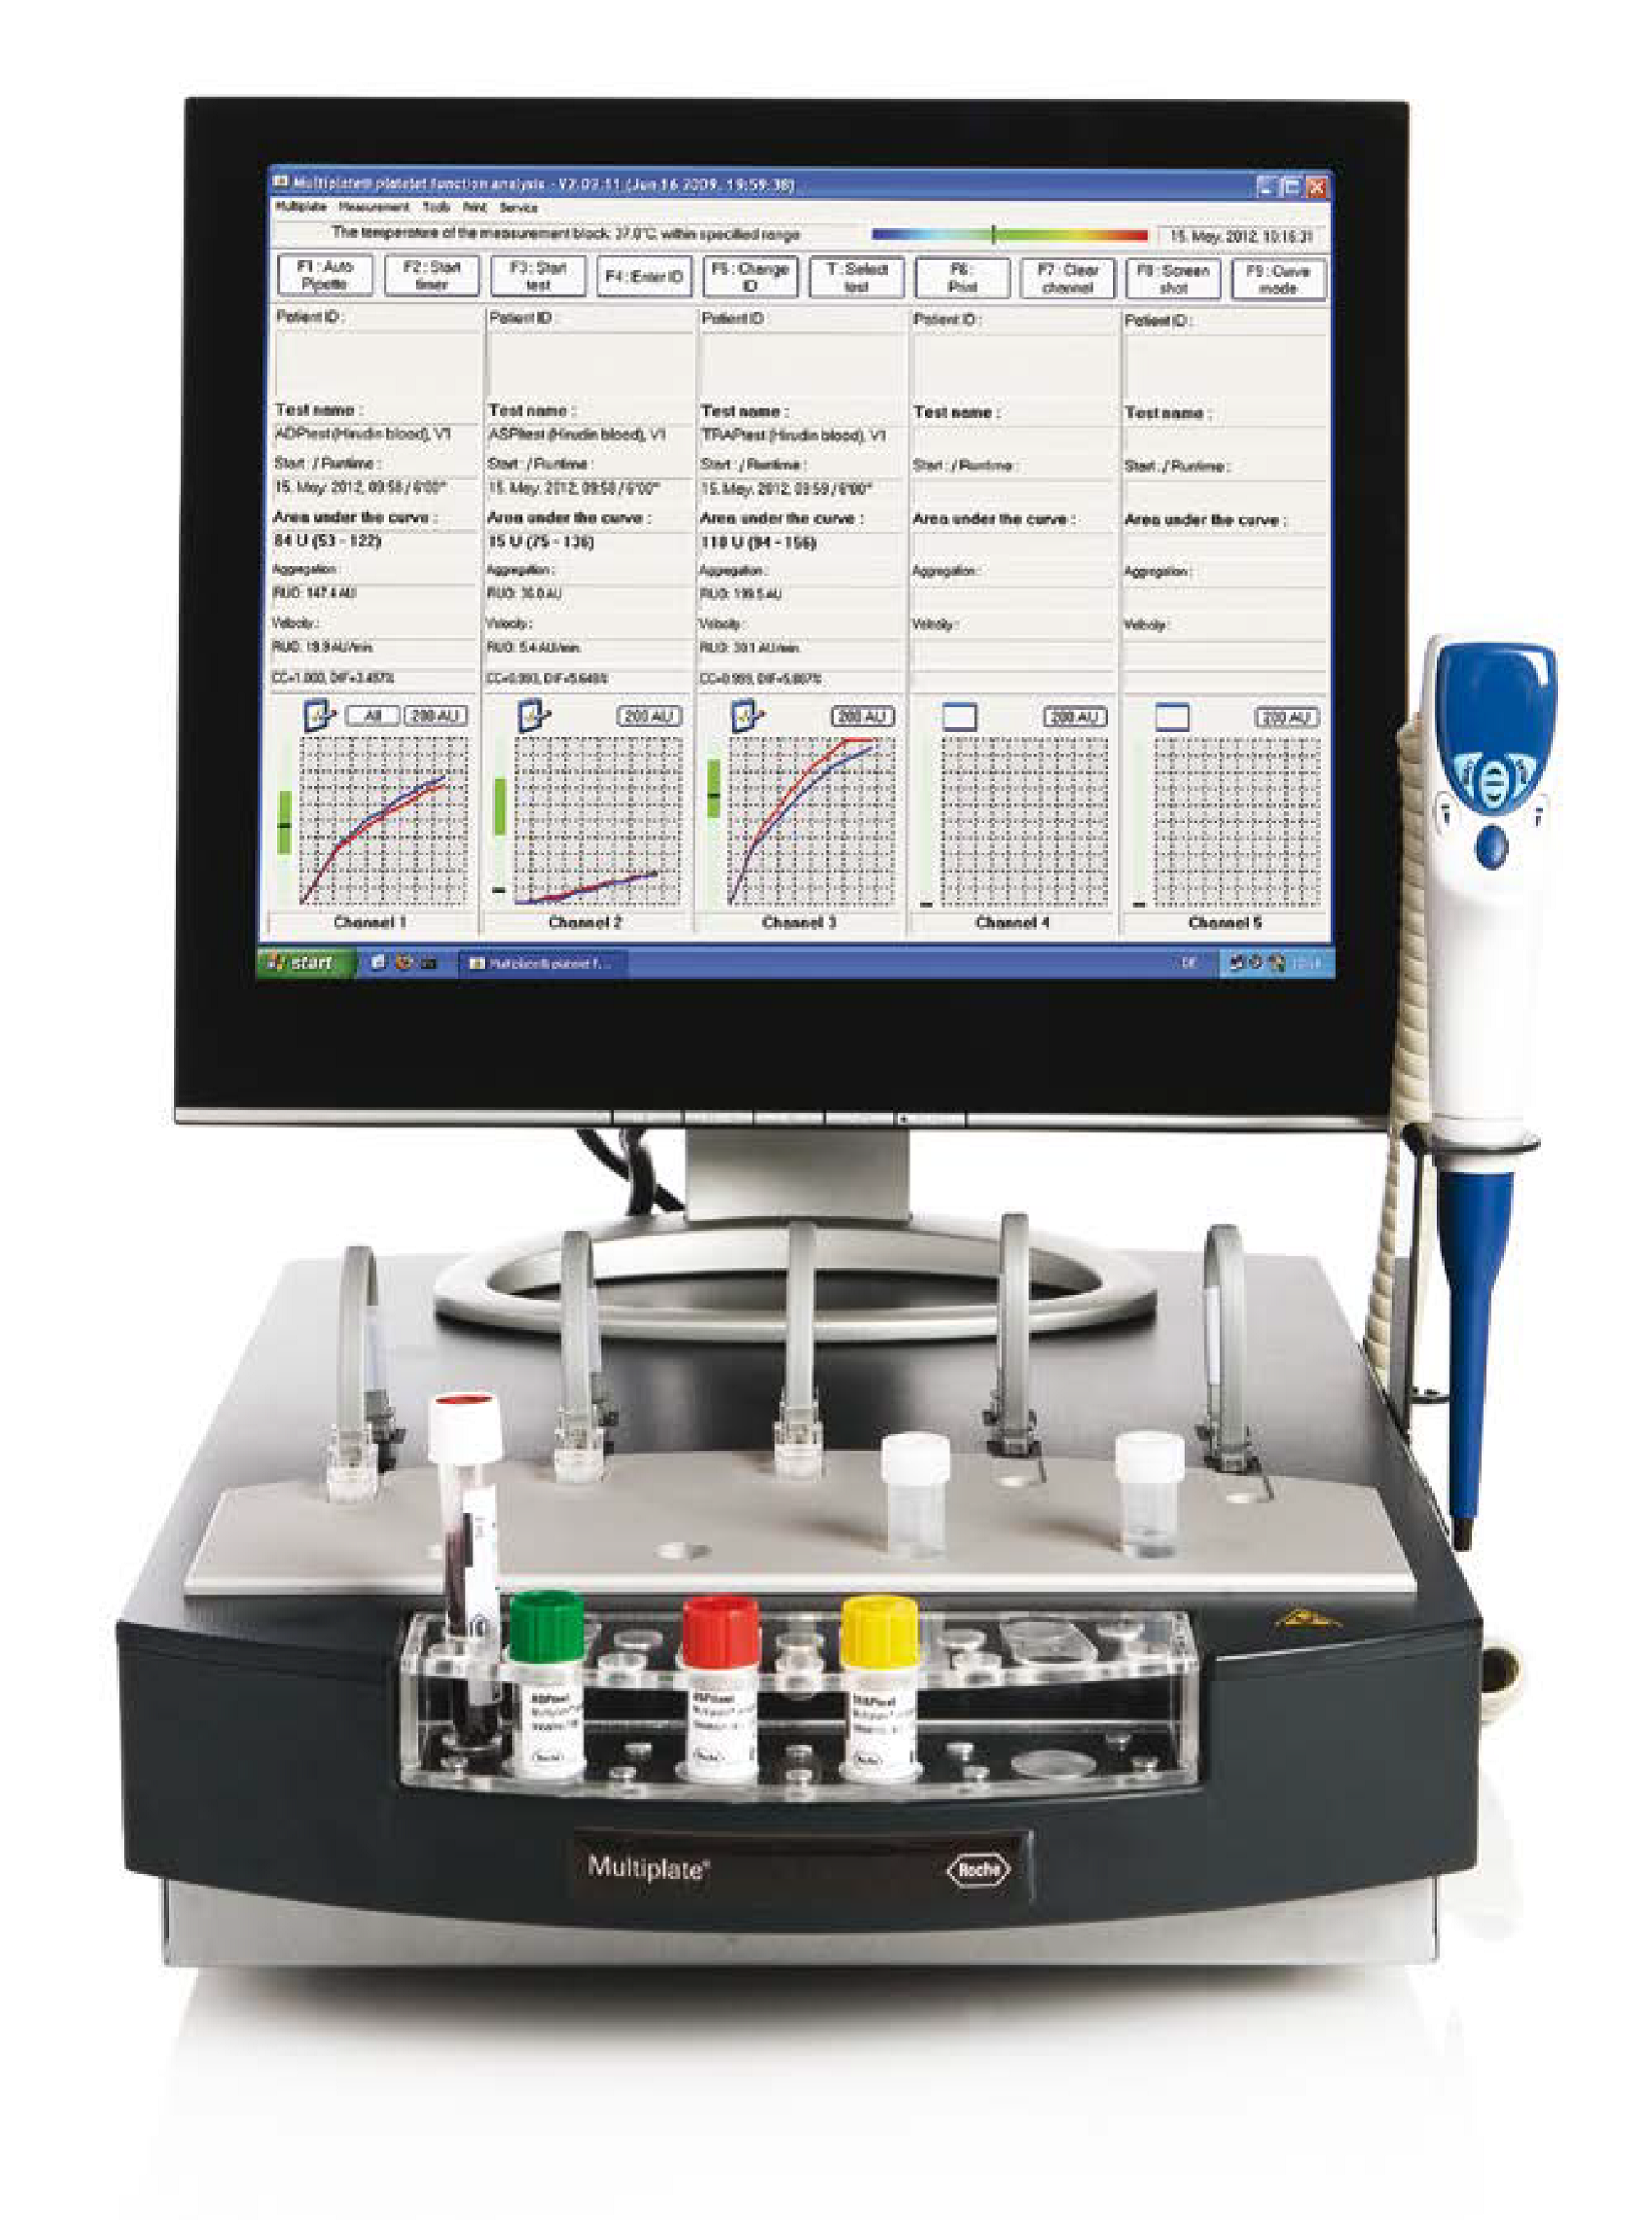
Multiplate is an analysis method using impedance technology that in vitro graphically and numerically illustrates platelet function. Multiplate uses three different reagents (TRAP, ASPI, and ADP) and is suitable for measuring the effect of antiplatelet drugs such as aspirin (ASA), clopidogrel (Plavix), and abciximab (Reopro). Multiplate can be used to monitor the effect of antiplatelet therapy, assess dose adjustments, and check the residual effect after discontinuation.
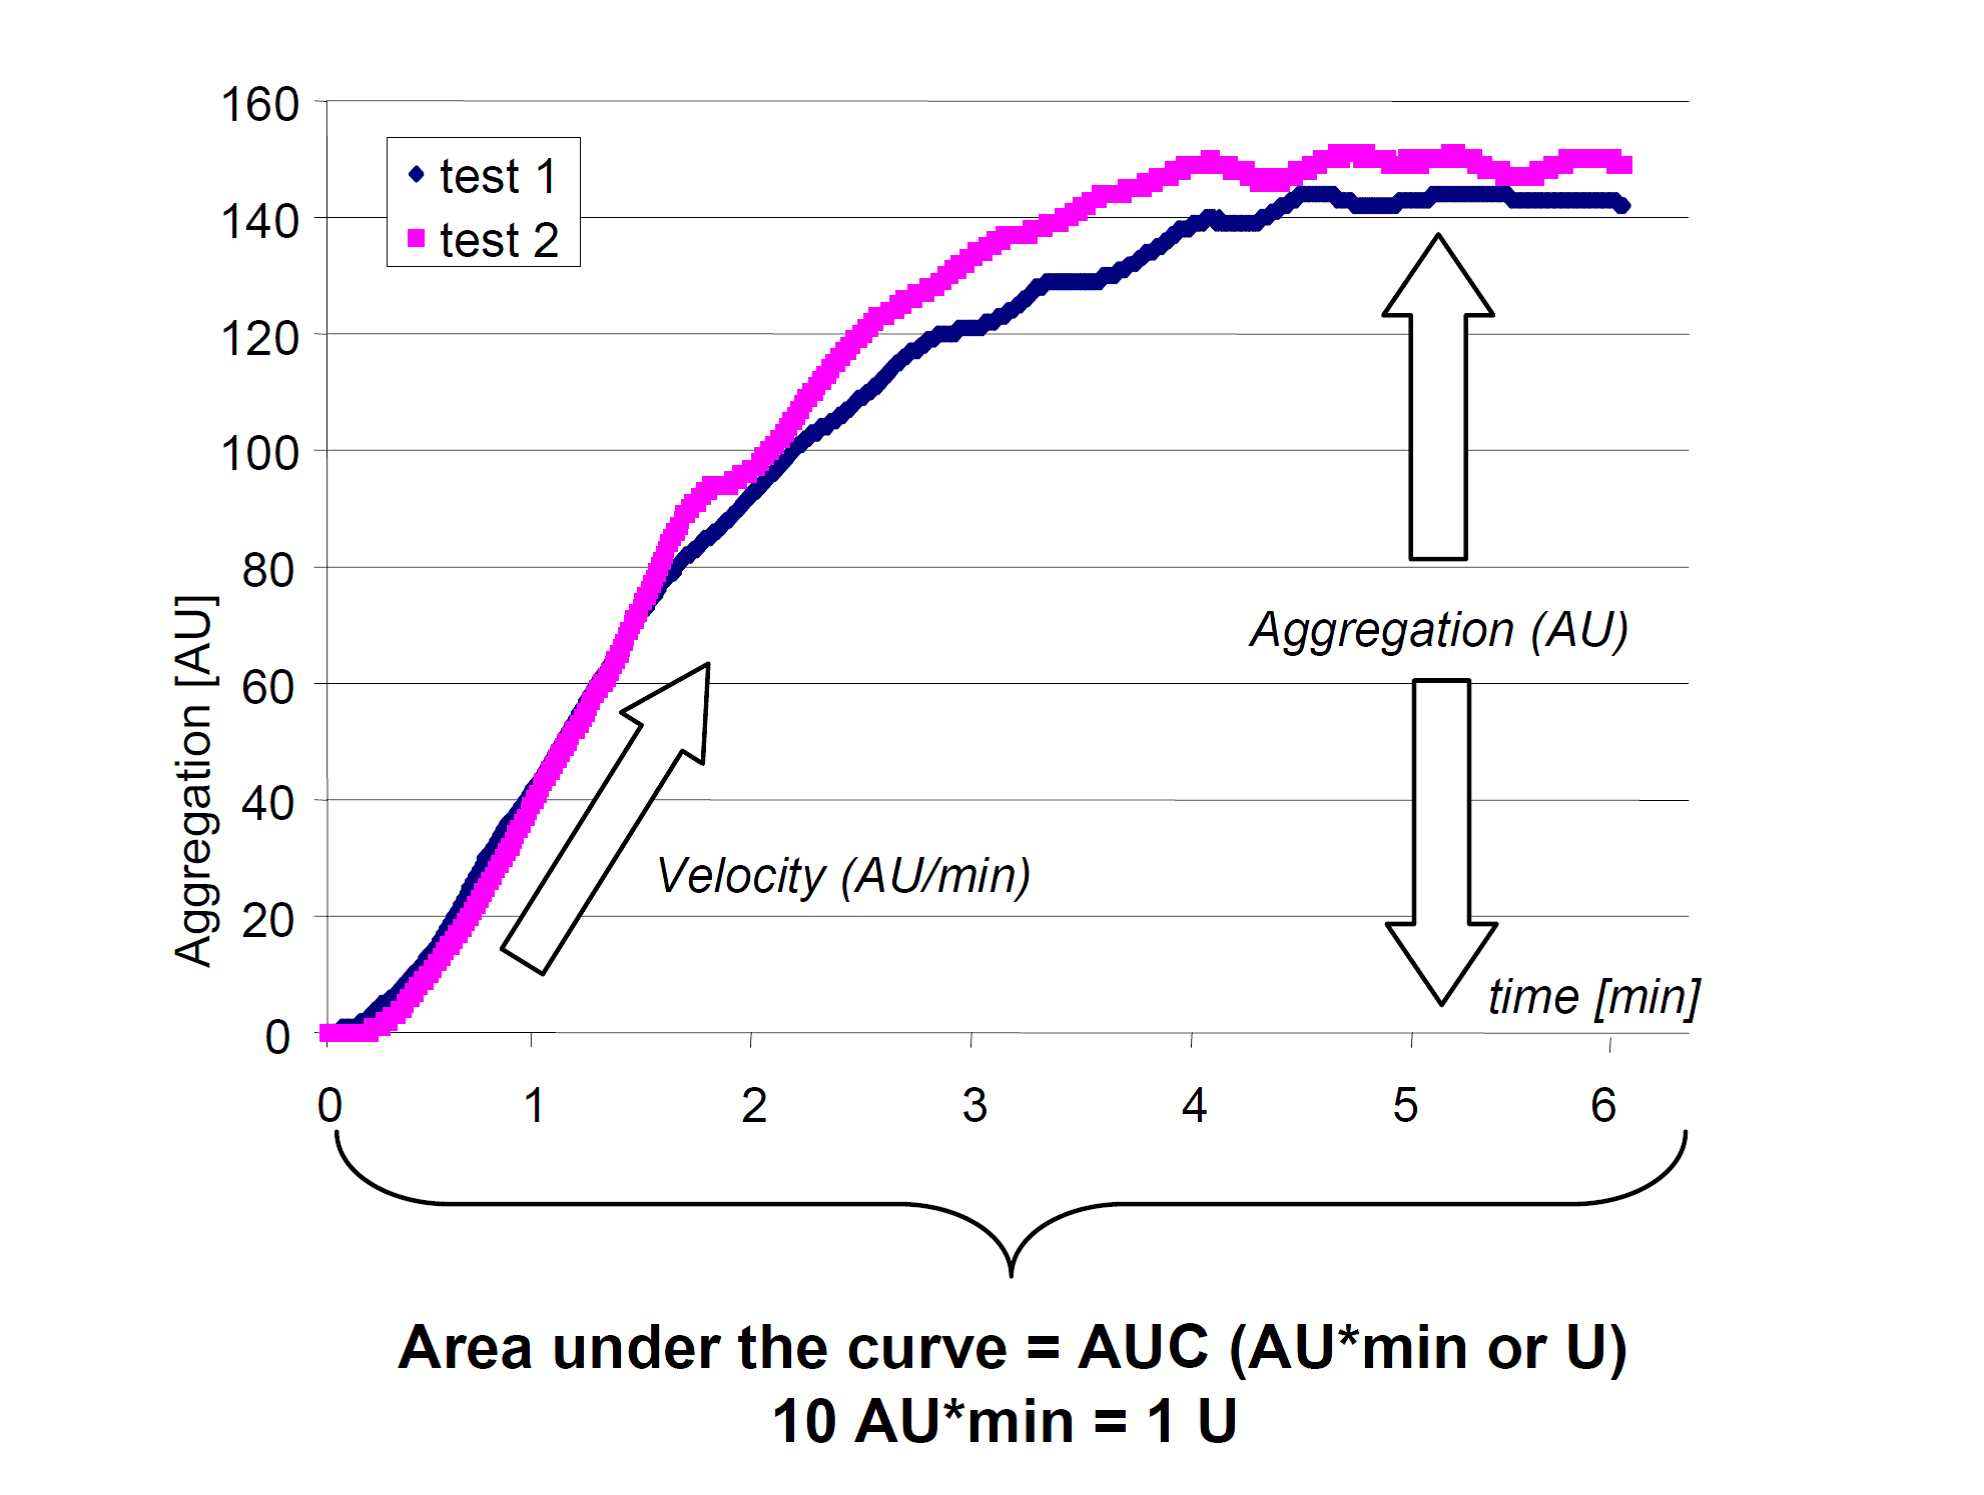
Multiplate consists of a dual impedance meter that measures how platelets in whole blood aggregate on the surface of a metal sensor, affecting electrical resistance. It measures the degree of platelet inhibition. Multiplate consists of three separate tests: TRAP test, ASPI test, and ADP test. Each test involves provoking platelet aggregation with a reagent, either TRAP, ASPI, or ADP. The result is displayed as a graph over time, with numerical values also available. The graph is similar for all three tests and is compared to a standard, as shown in the figure below. The test results are displayed both graphically and numerically, with values measured in units (U). Normal values differ for the three tests.
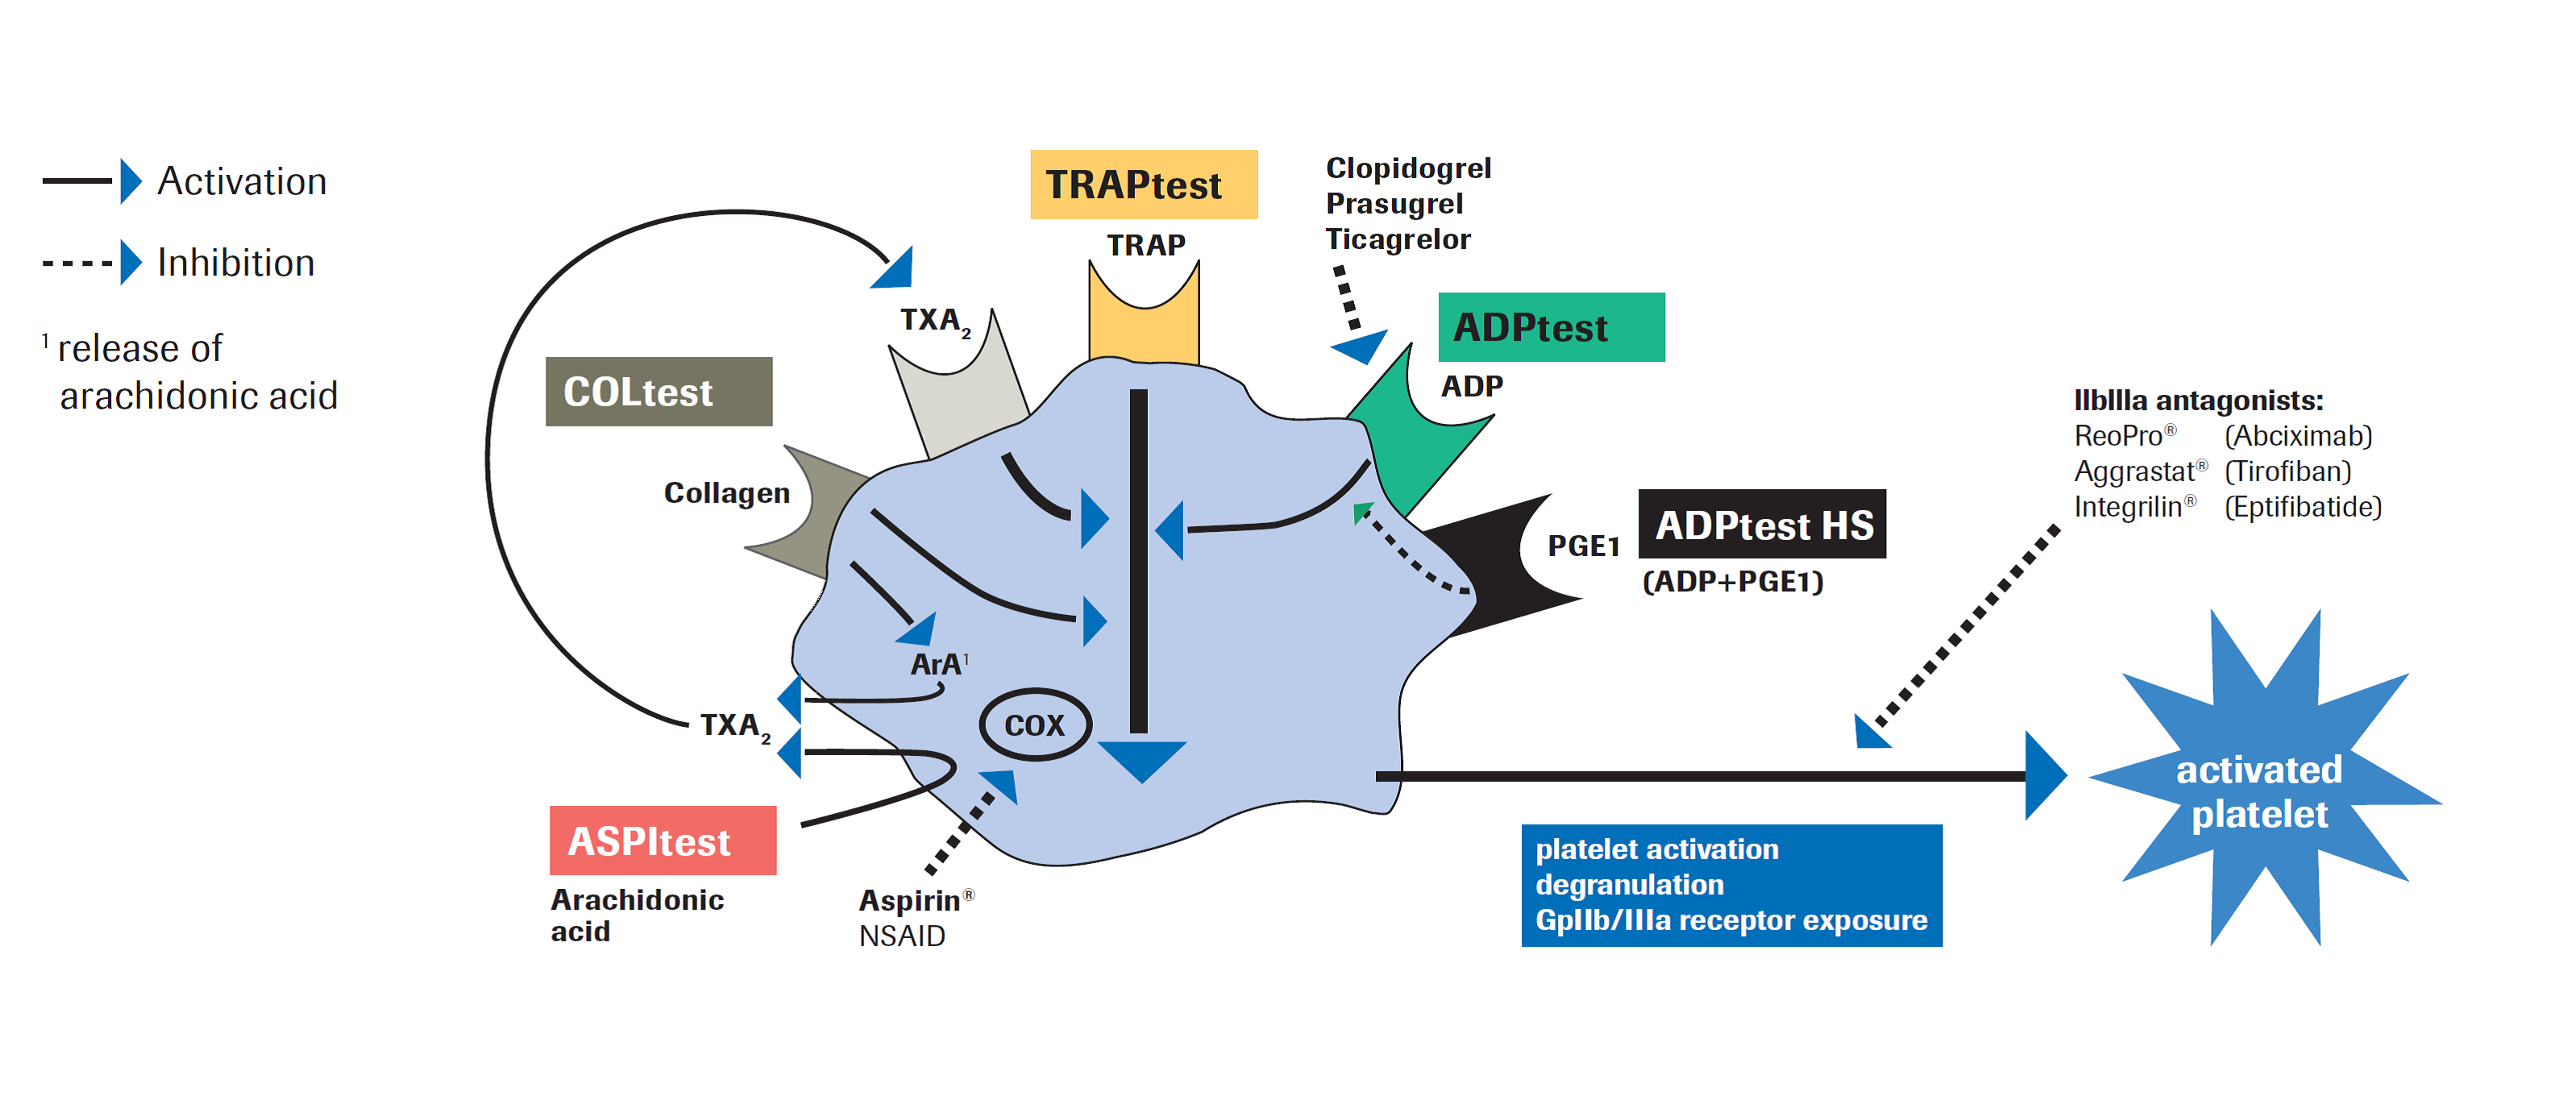
TRAP Test
The reagent consists of a thrombin receptor activating peptide (TRAP-6). This reagent is a potent platelet activator that stimulates platelet aggregation through thrombin receptors. The test responds to GpIIb/IIIa antagonists. The TRAP reaction is inhibited by abciximab (Reopro) and tirofiban (Aggrastat) with little or no inhibition from ASA or clopidogrel. Numerical measurements are compared to a standard. Normal values for the TRAP test are 80-160 U. Therapeutic levels are indicated below 30 U. Low responder: 30-80 U, and Non-responder: > 80 U. The graphical curve remains elevated in the TRAP test under the influence of ASA or clopidogrel.
ASPI Test
The reagent consists of arachidonic acid, which is the substrate for the enzyme cyclooxygenase in platelets. Cyclooxygenase converts arachidonic acid into thromboxane A2, a potent platelet activator. When cyclooxygenase is blocked, the formation of thromboxane A2 is inhibited, preventing or reducing platelet activation. The test is sensitive to cyclooxygenase inhibitors, GpIIb/IIIa antagonists, and a deficiency of GpIIb/IIIa receptors. It does not respond or only weakly reacts to ADP receptor blockade from clopidogrel or similar drugs. The test is mainly sensitive to ASA and NSAIDs. Clopidogrel, on the other hand, produces a normal reaction, while Reopro reduces the reaction. Under the influence of ASA, the ASPI test curve becomes flattened compared to the normal high curve. Clopidogrel does not affect the curve’s appearance.
ADP Test
The reagent consists of ADP, which activates platelets via ADP receptors. The test is sensitive to drugs such as clopidogrel, prasugrel, and ticagrelor. These drugs act on the P2Y12 receptor, considered the most important for ADP. The test is insensitive to ASA and NSAIDs. An alternative test for clopidogrel is the ADP test HS (High Sensitivity), which adds Prostaglandin E1 to ADP. Under the influence of clopidogrel (but not ASA), the ADP test curve becomes flattened compared to the normally high curve.
Antiplatelet Drugs in Multiplate
Normal results of various antiplatelet drugs in Multiplates different tests
| Drug | TRAP | ASPI | ADP |
|---|---|---|---|
| ASA (Acetyl salicylic acid) | Normal | Reduced | Normal |
| NSAID | Normal | Reduced | Normal |
| Clopidogrel (Plavix) | Normal | Normal | Reduced |
| Abciximab (Reopro) | Reduced | Reduced | Reduced |
| Reference values AUC (U) | 94-156 | 74-136 | 53-122 |
Reference Interval in Multiplate
Reference values of various thrombocyte inhibiting agents in Multiplate’s various tests
| Drug | Test | Blood donor (U) | Therapeutic level (U) | Low responder (U) | Non responder (U) |
|---|---|---|---|---|---|
| Acetylsalicylic Acid | ASPI | 65-119 | < 30 | 30-65 | >65 |
| Clopidogrel | ADP | 45-98 | < 30 | 30-45 | >45 |
| Abciximab | TRAP | 80-160 | < 30 | 30-80 | >80 |
Disclaimer:
The content on AnesthGuide.com is intended for use by medical professionals and is based on practices and guidelines within the Swedish healthcare context.
While all articles are reviewed by experienced professionals, the information provided may not be error-free or universally applicable.
Users are advised to always apply their professional judgment and consult relevant local guidelines.
By using this site, you agree to our Terms of Use.
